


Eucalyptus nitens, recovery and economics of processing 15 year old trees for solid timber
Report Date: May 2015
Author: Dean Satchell, Sustainable Forest Solutions, R.D. 1 Kerikeri, Northland 0294
+64 21 2357554
Special thanks and acknowledgement go to:
- MPI Sustainable Farming Fund
- Neil Barr Farm Forestry Foundation
- John Fairweather Specialty Timbers
- North Canterbury, South Canterbury, South Otago and Southland branches of NZFFA
- NZFFA Eucalyptus Action Group
- NZFFA Research committee
Appendix 2: Sawn timber price estimates
Appendix 3: Literature review - Value-based survey pricing methods
Appendix 4: Literature review - Estimating profitability of growing E. nitens for solid timber production
Appendix 5: Sawmilling method
Appendix 6: Flooring price survey instrument
Appendix 7: Survey results table
Appendix 8: Survey analysis
Appendix 9: Wood physical properties, test results
Appendix 10: Glossary of terms
Appendix 11: Case study stand plot
Appendix 12: Comparison between levels of internal and surface checking
Appendix 13: Air drying experiment
Appendix 14: Sensitivity analysis
Results
1. Survey price estimates for sawn timber
Price estimates for 15 year old E. nitens flooring timber profiiles were estimated using a market survey approach. Appearance, hardness and movement in service were compared between E. nitens (comparison species) and Victorian ash (reference species) imported from Australia. Price estimates for laminated panel feedstock were estimated using the residual value method.
Graded-Pairs Pricing Method
| Species | Victorian ash |
| Eucalyptus nitens price estimate, compared with Victorian ash | 94.44% |
In addition, discounts for grades, widths and lengths were based on comparisons:
| Grades | Standard grade | High feature grade |
| Discount from Select grade | 15.93% | 30% |
| Widths | 125 mm width | 100 mm width |
| Discount from 150 mm width | 5.56% | 10.37% |
| Lengths1 | 600 - 1200 mm length | 300 - 600 mm length |
| Discount from >1200mm length | 0%2 | 21%3 |
1. Price estimates for lengths involved estimating costs and values of finished products from which residual value was then calculated.
2. For 600 mm - 1200 mm lengths the price was assumed to be the same as > 1200 mm lengths but was discounted by the additional cost of end-matching ($0.43 for 100 mm width, $0.53 for 125 mm width and $0.64 for 150 mm width).
3. For 300 mm - 600 mm lengths price comparisons were for a finished floor made from 300 mm - 600 mm lengths compared with a standard random length strip floor made from mostly >1200 mm lengths. Costs for producing 300 mm clear lengths from random-length "shorts" were estimated as the cost of edge-jointing 300 mm - 600 mm shooks ($1.21 for 100 mm width, $1.51 for 125 mm width and $1.81 for 150 mm width).
E. nitens Wholesale Price per Cubic Metre
Prices per nominal cubic metre of graded timber were calculated for each product profile and are presented below.
| Length (mm) | Width (mm) | Price for Select / Clears grade | Price for Standard Grade | Price for Feature / High Feature Grade |
|---|---|---|---|---|
| >1200 | 150 | $ 1309.33 | $ 1101.33 | $ 917.33 |
| >1200 | 125 | $ 1235.20 | $ 1040.00 | $ 864.00 |
| >1200 | 100 | $ 1184.00 | $ 996.00 | $ 832.00 |
| 600 - 1200 | 150 | $ 1194.67 | $ 986.67 | $ 802.67 |
| 600 - 1200 | 125 | $ 1100.80 | $ 902.40 | $ 729.6 |
| 600 - 1200 | 100 | $ 1016.00 | $ 828.00 | $ 660.00 |
| 300 - 600 | 150 | $ 717.33 | $ 552.00 | $ 405.33 |
| 300 - 600 | 125 | $ 595.20 | $ 438.40 | $ 300.80 |
| 300 - 600 | 100 | $ 460.00 | $ 308.00 | $ 176.00 |
Detailed price results for the graded-pairs pricing method are in Appendix 2
Constant-Sum Allocation Method
Part worth utilities for between-species quality characteristics (appearance, hardness, movement in service)
|
Between species |
Victorian ash (soft, small levels of movement) | 15 year old Eucalyptus nitens (very soft, small levels of movement) | American white oak (hard, medium levels of movement) |
| Part worth ulilities | 7.46 | 6.94 | 7.95 |
| Price estimate as a percentage comparison | Victorian ash | American white oak |
| Eucalyptus nitens | 93% | 87.3% |
| Price estimate as a percentage comparison | Eucalyptus nitens | American white oak |
| Victorian ash | 107.5% | 93.8% |
| Price estimate as a percentage comparison | Victorian ash | Eucalyptus nitens |
| American white oak | 106.5% | 114.5% |
Part worth utilities for within-species quality characteristics (grade, width and length)
| 150 mm width | 125 mm width | 100 mm width | |||||||||||||||||||
| Select grade |
|
|
|
||||||||||||||||||
| Standard grade |
|
|
|
||||||||||||||||||
| High Feature grade |
|
|
|
E. nitens Wholesale Price per Cubic Metre
Prices per nominal cubic metre of graded timber were calculated for each product profile and are presented below.
| Length (mm) | Width (mm) | Price for Select / Clears grade | Price for Standard Grade | Price for Feature / High Feature Grade |
|---|---|---|---|---|
| >1200 | 150 | $ 1333.33 | $ 1205.33 | $ 1072.00 |
| >1200 | 125 | $ 1286.40 | $ 1155.20 | $ 1024.00 |
| >1200 | 100 | $ 1216.00 | $ 904.00 | $ 956.00 |
| 600 - 1200 | 150 | $ 1149.33 | $ 1021.33 | $ 888.00 |
| 600 - 1200 | 125 | $ 1100.80 | $ 972.80 | $ 838.40 |
| 600 - 1200 | 100 | $ 1032.00 | $ 1088.00 | $ 772.00 |
| 300 - 600 | 150 | $ 1037.33 | $ 906.67 | $ 776.00 |
| 300 - 600 | 125 | $ 988.80 | $ 860.80 | $ 908.00 |
| 300 - 600 | 100 | $ 920.00 | $ 792.00 | $ 660.00 |
Detailed price results for the constant-sum allocation method are in Appendix 2
Price estimates for laminated panel feedstock and joinery grade narrow width boards
The narrow-width boards (50 mm and 75 mm wide) were priced as a residual value by estimating costs to produce a laminated panel product and subtracting these from the sale price of two laminated panels, each produced from the two board lengths. The results are presented below.
| Length (mm) | Width (mm) | Four faces clear | Two faces / edges clear | One edge clear |
|---|---|---|---|---|
| 300-1500 | 50 | $ 1080.00 | $ 1080.00 | $ 1080.00 |
| > 1500 | 50 | $ 1904.00 | $ 1904.00 | $ 1904.00 |
| 300 - 1500 | 75 | $ 1616.00 | $ 1616.00 | $ 1082.67 |
| > 1500 | 75 | $ 1898.67 | $ 1898.67 | $ 1898.67 |
2. Processing results
Log volumes
A scale diagram of the case study stand (See Appendix 11) was produced on which two plots of 224 m2 each (8 m x 28 m) were positioned that included a total of 21 trees and excluded edge trees.
Plots were positioned to avoid edge trees. Edge trees were observed to be larger than trees within the stand and thus not representative of trees within a larger stand for the purpose of deriving per hectare values. Selected values from stand trees are presented below.
| Average Basal Area per Tree (m2) | Average Stem Volume per Tree (m3) | Average DBH Over Bark (cm) | Average Tree Height (m) | Average Sawlog SED (cm) | Average Sawlogs per tree >25cm SED | |
|---|---|---|---|---|---|---|
| Plot Trees | 0.124 | 1.50 | 43.03 | 31.24 | 32.94 | 3.87 |
| Stand Trees | 0.156 | 1.83 | 47.73 | 31.75 | 35.28 | 4.38 |
Quantities from the two plots are presented below and the plot average for each value is scaled to per hectare estimates. Sawlogs were categorised as those logs larger than 25 cm SED and pulp logs were categorised as logs between 10 cm and 25 cm SED. All logs were 3 m length.
| Trees | Basal Area (m2) | Stem Volume (m3) | Merchantable Volume (m3) | Buttlog Volume (m3) | Headlog Volume (m3) | Pulp-wood Volume (m3) | |
|---|---|---|---|---|---|---|---|
| Plot 1 | 11 | 1.34 | 15.92 | 15.55 | 7.17 | 4.43 | 3.94 |
| Plot 2 | 10 | 1.27 | 15.47 | 15.15 | 6.78 | 4.90 | 3.47 |
| Plot Average | 10.5 | 1.31 | 15.69 | 15.35 | 6.98 | 4.67 | 3.71 |
| Per Hectare | 469 | 58.29 | 700.54 | 685.20 | 311.46 | 208.29 | 165.45 |
| Average as Percentage of Total | - - | - - | 100 % | 98 % | 44.5 % | 29.7 % | 23.6 % |
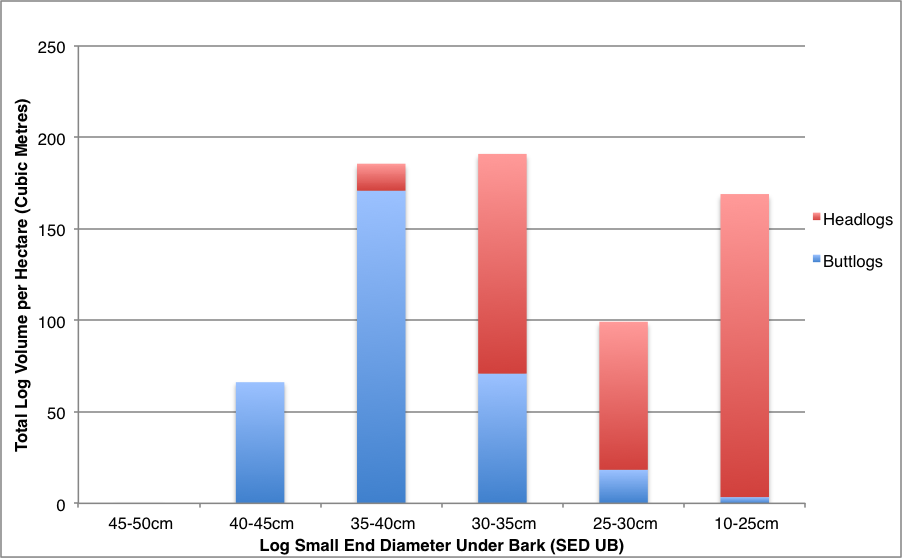
Log volume estimates averaged between plots and scaled to per-hectare values and categorised according to SED’s in 5 cm increments are presented below
Estimated volume recoveries per hectare as diameter categories.
Product quantities from sawlogs
Percentage of overall sawlog green weight allocated to products and by-products was estimated as percentage of total weight (in green condition). Slabwood weighed 38% of total green weight. Based on volume of sawn timber and estimated volume per cubic metre, green weight of sawn boards was estimated to be 48% of total green log weight. Sawdust by-product weight was estimated to be 14% of total green log weight.
Total nominal sawn timber production from sample logs was 4.06 m3, with headlogs producing 42.72 % of sawn timber (1.74 m3) and buttlogs producing 57.28 % (2.33 m3) of sawn timber.
Sawmill efficiency
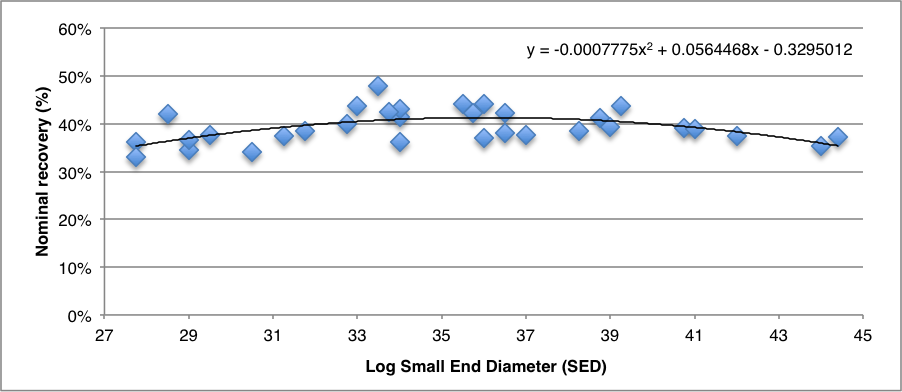
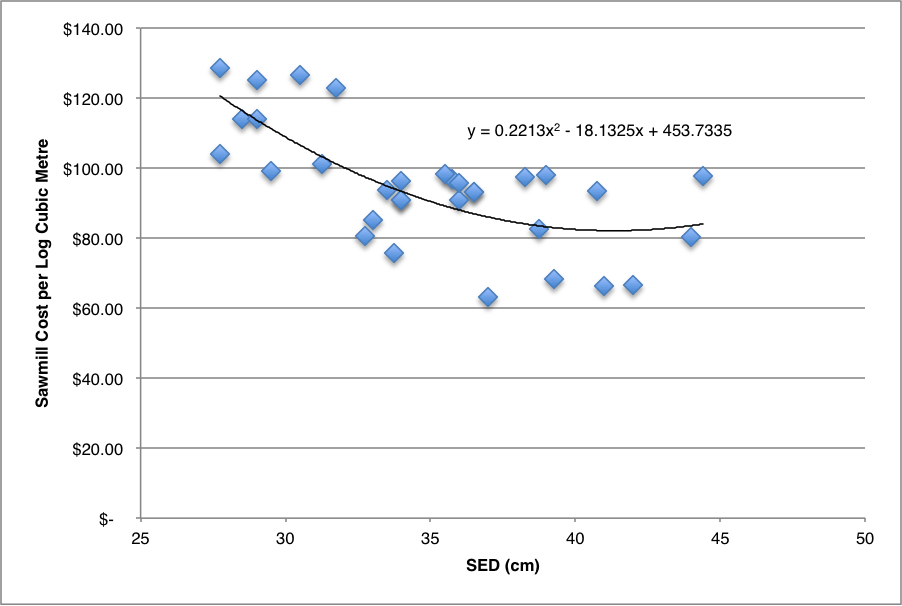
Sawn timber recovery as a percentage was found to have a statistically significant relationship (P = 0.001) with log small end diameter for the Woodmizer equipment and sample logs. The best fit was a second degree polynomial regression, presented below.
Nominal sawn timber recoveries according to log small end diameter.
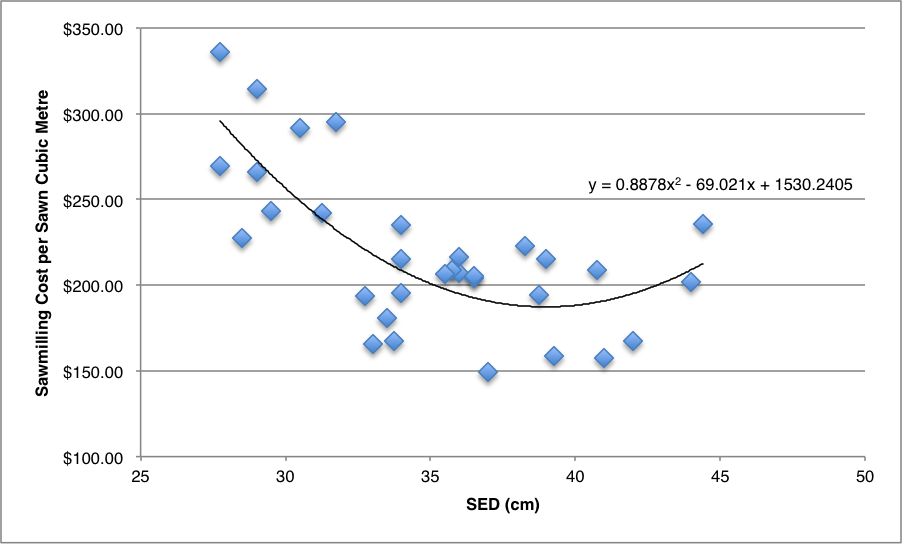
Sawmilling cost per nominal sawn cubic metre held a statistically significant relationship (P = 0.0012) with SED and the second degree polynomial regression curve revealed an optimal diameter range of between approximately 35 cm SED and 42 cm SED for this equipment. The relationship is presented below.
Sawmilling cost per nominal sawn cubic metre of production.
Sawn product quantities
Product nominal lengths and widths produced from unpruned headlogs are presented below.
| Product | Clears/Select grade | Standard grade | Feature/High Feature grade |
|---|---|---|---|
| 300 - 600 mm length | 2.25 % | 0.14 % | 0 % |
| 600 - 1200 mm length | 8.05 % | 1.34 % | 1.73 % |
| > 1200 mm length | 35.14 % | 10.41 % | 7.31 % |
| Product | Four faces clear | Two faces clear | One face clear |
|---|---|---|---|
| 300 - 1500 mm length | 1.98 % | 0 % | 2.76 % |
| > 1500 mm length | 7.21 % | 1.16% | 10.31 % |
| Product | Clears/Select Grade | Standard Grade | Feature/High Feature Grade |
|---|---|---|---|
| 300 - 600 mm Length | 0.64 % | 0.23 % | 0 % |
| 600 - 1200 mm Length | 2.95 % | 1.35 % | 0.66 % |
| > 1200 mm Length | 62.7 % | 3.39 % | 2.42 % |
| Product | Four Faces Clear | Two Faces Clear | One Face Clear |
|---|---|---|---|
| 300 - 1500 mm length | 0.12 % | 0.2 % | 0.05 % |
| > 1500 mm length | 4.86 % | 0.23 % | 1.78 % |
Processing costs
Results from processing logs into sawn timber products are presented as sawmill costs, drying costs and processing costs, each process being independent but contributory to overall product costs and thus residual value.
Sawmill costs amounted to $89.75 per hour of operation. Sawmill costs per sawn cubic metre are presented here and sawmill costs per log cubic metre are presented here.
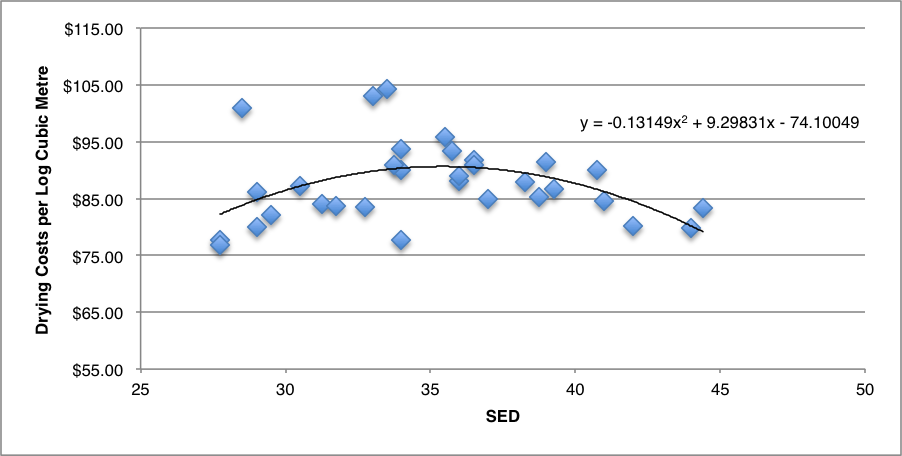
Drying cost estimates per nominal sawn cubic metre were $202.28 and steam reconditioning costs were estimated to be an additional $30.00.
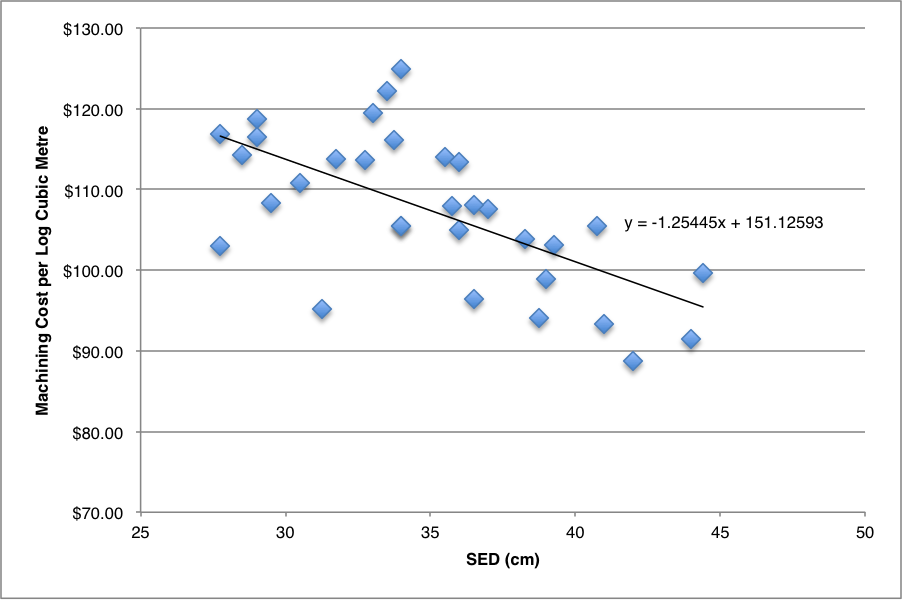
Machining costs included both a fixed cost per nominal cubic metre of production plus a variable cost per lineal metre (for all widths) of production:
- Cost per cubic metre = $73.86 (includes boron treatment)
- Cost per lineal metre = $0.41
Production volume
Volume of production influences costs per unit of volume output. Annual production volume estimates for the case study sawmilling operation were based on a full time operation, or 229 days per year at 8 hours per day.
Annual production volume estimates for the case study processing operation were:
- Sawmill production = 756.85 cubic metres.
- Machining production = 171,750 lineal metres.
Defect in sawn boards
The level of defect present in sawn boards has an influence over log residual value. Defect was quantified and categorised during grading and is presented below as percentages of nominal sawn timber recoveries for each of the two grading methods used, both including and excluding collapse defect.
| Defect Category | Farm Forestry Timbers Grading | Farm Forestry Timbers Grading, Ignore Collapse | Australian Standards Grading | Australian Standards Grading, Ignore Collapse |
|---|---|---|---|---|
| End splits | 3.60 % | 3.60 % | 3.60 % | 3.60 % |
| Collapse | 4.60 % | 0.00 % | 5.46 % | 0.00 % |
| Wanea | 0.07 % | 0.07 % | 0.07 % | 0.07 % |
| Skipb | 0.20 % | 0.20 % | 0.33 % | 0.33% |
| Wantc | 0.20 % | 0.20 % | 0.20 % | 0.20% |
| Checksd | 1.78 % | 1.78 % | 3.0 % | 3.0 % |
| Boxe | 3.59 % | 3.59 % | 3.81 % | 3.81 % |
| Tongue crook | 0 % | 0 % | 0.13 % | 0.05 % |
| Tongue collapse | 0 % | 0 % | 0.86 % | 0 % |
| Total | 14.04 % | 9.44 % | 16.47 % | 10.93 % |
aWane: End Taper and End Wane was docked but not classed as recovered sawn timber volume.
bSkip: Skip resulting from board cupping, edge wane, face wane and twist.
cWant: Want included machining voids such as chipping.
dChecks: Box defect caused by excessive checking not meeting grade rules.
eBox: Natural defect such as knots and holes that do not meet grade rules.
Grade recoveries
Grade recoveries for all sawn timber widths as a percentage of total nominal recoveries of sawn timber for Farm Forestry Timbers grades totalled to 85.94%, and ignoring collapse defect totalled 90.53%. The two tables below present grade recoveries for 100 mm, 125 mm and 150 mm width boards and grade recoveries for 50 mm and 75 mm width boards.
| Grade and Length | Farm Forestry Timbers Grade | Farm Forestry Timbers Grade, Ignore Collapse | Australian Standards Grade | Australian Standards Grade, Ignore Collapse |
|---|---|---|---|---|
| Select/Clears 300 - 600 mm | 1.31 % | 1.15 % | 1.72 % | 1.53 % |
| Select/Clears 600 - 1200 | 5.12 % | 5.26 % | 5.61 % | 5.58 % |
| Select/Clears >1200 mm | 50.71 % | 52.61 % | 50.7 % | 52.99 % |
| Standard 300 - 600 mm | 0.21 % | 0.14 % | 0.25 % | 0.22 % |
| Standard 600 - 1200 mm | 1.29 % | 1.33 % | 1.28 % | 1.3 % |
| Standard > 1200 mm | 6.26 % | 6.98 % | 6.08 % | 7.16 % |
| Feature/High Feature 300 - 600 | - - | - - | 0.03 % | 0.03 % |
| Feature/High Feature 600 - 1200 mm | 1.36 % | 1.39 % | 1.03 % | 1.23 % |
| Feature/High Feature > 1200 mm | 5.57 % | 5.67 % | 1.89 % | 2.25 % |
| Total | 71.83 % | 74.53 % | 68.59 % | 72.29 % |
| Length | FFT Panel Lam and Joinery grade | FFT Panel Lam and Joinery Grade, Ignore Collapse |
|---|---|---|
| Two faces clear 300 - 1500 mm | 0.12 % | 0.12 % |
| Two faces clear > 1500 mm | 0.62 % | 0.76 % |
| One face clear 300 - 1500 mm | 1.21 % | 1.1 % |
| One face clear > 1500 mm | 5.43 % | 6.13 % |
| Four faces clear 300 - 1500 mm | 0.91 % | 0.91 % |
| Four faces clear > 1500 mm | 5.82 % | 6.98 % |
| Total | 14.11 % | 16.0 % |
Log Pricing Models and Residual Values
Cost and revenue estimates were produced for each plot log from predictive models based on sample log data.
Sawn timber revenues
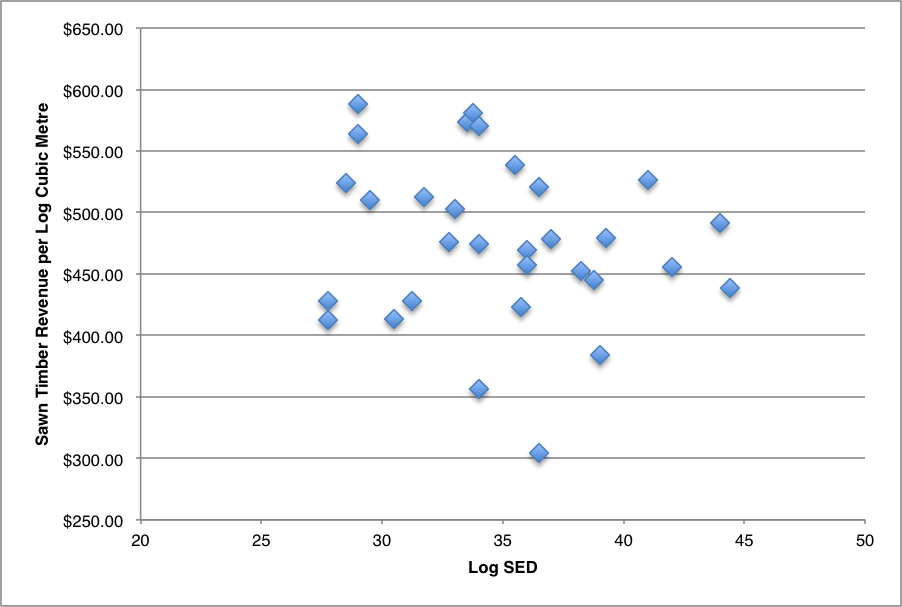
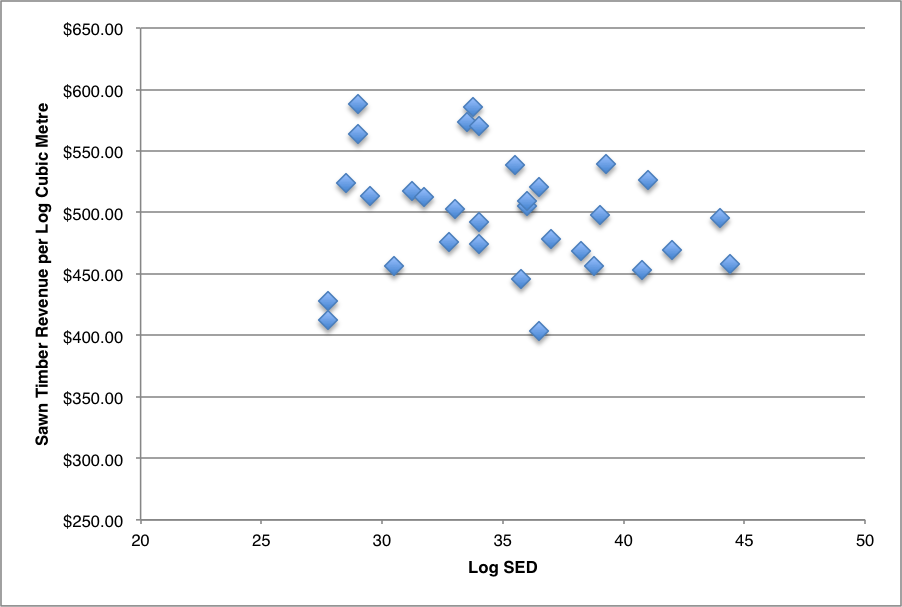
Revenues at the log level were calculated as the sum of board prices per log for each grading and pricing method. The sample log data showed no statistically significant differences below the 5% threshold between sawn timber revenue from the sample logs according to log SED’s (see below).
| Grading and Pricing Profile | Intercept | Slope | P Value |
|---|---|---|---|
| Farm Forestry Timbers Grading, Graded-Pairs Pricing | 634.9333 | -5.0587 | 0.0636 |
| Farm Forestry Timbers Grading, Constant-Sum Allocation Pricing | 661.8305 | -5.2965 | 0.0505 |
| Australian Standard Grading, Graded-Pairs Pricing | 641.6792 | -5.6025 | 0.0701 |
| Australian Standard Grading, Constant-Sum Allocation Pricing | 671.3272 | -5.9709 | 0.0545 |
The relationship between sawn timber revenue and SED, averaged between grading and pricing profiles, is presented graphically below, including and ignoring collapse defect.
Average sawn timber value according to SED.
Average sawn timber value per log cubic metre according to SED, Ignoring collapse defect.
Differences according to log position were significant only between log 1 and logs 2-5. There were no significant differences between all log positions under the scenario where collapse defect was ignored (i.e. assumed to have been reconditioned). Sawn timber revenue per log cubic metre (based on SED) for each scenario presented below.
| Grading and Pricing Profile | Log 1 | Logs 2-5 |
Average Revenue All Logs, Ignore Collapse |
|---|---|---|---|
| Farm Forestry Timbers Grading, Graded-Pairs Pricing | $ 465.781 | $ 504.31 | $ 494.91 |
| Farm Forestry Timbers Grading, Constant-Sum Allocation Pricing | $ 416.492 | $ 506.97 | $ 520.10 |
| Australian Standard Grading, Graded-Pairs Pricing | $ 376.963 | $ 480.07 | $ 493.65 |
| Australian Standard Grading, Constant-Sum Allocation Pricing | $ 391.894 | $ 497.84 | $ 510.24 |
1. P= 0.014
2. P= 0.0134
3. P= 0.0132
4. P= 0.0106
Sawn timber revenue per log cubic metre (see above) for each scenario was used to model sawn timber revenue per hectare (see below).
| Pricing and Grading Scenario | Farm Forestry Timbers Grading, Graded-Pairs Pricing | Farm Forestry Timbers Grading, Constant-Sum Allocation Pricing | Australian Standards Grading, Graded-Pairs Pricing | Australian Standards Grading, Constant-Sum Allocation Pricing |
|---|---|---|---|---|
| Not Reconditioned | $216,361 | $225,114 | $210,511 | $218,452 |
| Assumed Reconditioned | $233,229 | $241,057 | $229,092 | $236,764 |
Processing overheads
Processing overhead cost at 10% of sawn timber revenue averaged $21,760 per hectare between grading and pricing scenarios.
Processing costs
Processing costs comprised sawmill costs (see below), drying costs (see below) and machining costs (see below). Regressions for each processing cost contributing to residual value were found to be statistically significant per log cubic metre based on log SED. Second degree polynomial regressions were fitted for sawmill and drying costs whereas machining costs were fitted as linear.
Sawmilling costs per log cubic metre (P=0.0285).
Drying costs per log cubic metre (P=0.0095).
Machining costs per log cubic metre (P=2e-04).
Total processing costs
Summing processing overheads, sawmilling, drying and machining costs produced total processing costs per hectare, presented below.
| Pricing and Grading Scenario | Farm Forestry Timbers Grading, Graded-Pairs Pricing | Farm Forestry Timbers Grading, Constant-Sum Allocation Pricing | Australian Standards Grading, Graded-Pairs Pricing | Australian Standards Grading, Constant-Sum Allocation Pricing |
|---|---|---|---|---|
| Not Reconditioned | $159,533 | $160,408 | $158,948 | $159,742 |
| Assumed Reconditioned | $167,213 | $167,996 | $166,799 | $167,566 |
Residual values
Predicted residual values per log cubic metre for each combination of pricing and grading methods were estimated from predicted average sawn timber revenues per cubic metre for log 1 and logs 2-5, less predicted sawmilling costs, drying costs, processing costs and processing overheads per cubic metre. The residual value model was applied to plot logs and scaled to per hectare residual values. Total residual value per hectare was estimated for each pricing and grading scenario and is presented below.
| Pricing and Grading Scenario | Farm Forestry Timbers Grading, Graded-Pairs Pricing | Farm Forestry Timbers Grading, Constant-Sum Allocation Pricing | Australian Standards Grading, Graded-Pairs Pricing | Australian Standards Grading, Constant-Sum Allocation Pricing |
|---|---|---|---|---|
| Not Reconditioned | $67,196 | $75,074 | $61,931 | $69,078 |
| Assumed Reconditioned | $76,384 | $83,429 | $72,661 | $79,565 |
Discounted cash flows
Based on a 15-year rotation and a discount rate of 8.5%, residual values per hectare for each pricing and grading scenario are presented below.
| Pricing and Grading Scenario | Farm Forestry Timbers Grading, Graded-Pairs Pricing | Farm Forestry Timbers Grading, Constant-Sum Allocation Pricing | Australian Standards Grading, Graded-Pairs Pricing | Australian Standards Grading, Constant-Sum Allocation Pricing |
|---|---|---|---|---|
| Not Reconditioned | $18,217 | $20,352 | $16,789 | $18,727 |
| Assumed Reconditioned | $20,707 | $22,617 | $19,698 | $21,570 |
Revenue from secondary products (pulpwood, slab firewood and sawdust) are presented below as year 0 cash flows.
| Year | Pulpwood | Slab firewood | Sawdust |
|---|---|---|---|
| 0 | $292 | $4,866 | $1,502 |
Growing costs and harvest/transport costs per hectare, discounted to year 0, are presented below, along with gross payments totalled to year 15.
| Year | Operational Growing Cost | Annual Growing Cost | Land Rental Growing Cost | Logging, Loading and Transport |
|---|---|---|---|---|
| 0 | $2,283 | $4,417 | $6,376 | $10,876 |
| 15 | $3,479 | $4,028 | $7,059 | $36,976 |
Net present value
Based on a 15-year rotation and a discount rate of 8.5%, net present value per hectare for each pricing and grading scenario is presented below.
| Pricing and Grading Scenario | Farm Forestry Timbers Grading, Graded-Pairs Pricing | Farm Forestry Timbers Grading, Constant-Sum Allocation Pricing | Australian Standards Grading, Graded-Pairs Pricing | Australian Standards Grading, Constant-Sum Allocation Pricing |
|---|---|---|---|---|
| Not Reconditioned | -$564 | $1,571 | -$1,992 | -$54 |
| Assumed Reconditioned | $1,926 | $3,836 | $917 | $2,789 |
Log Position as a Driver for Log Residual Value
Log physical characteristics varied according to log position in the tree and a number of relationships were evident. These are presented because of the potential for these to influence log residual value if sawn for solid timber.
Density and hardness
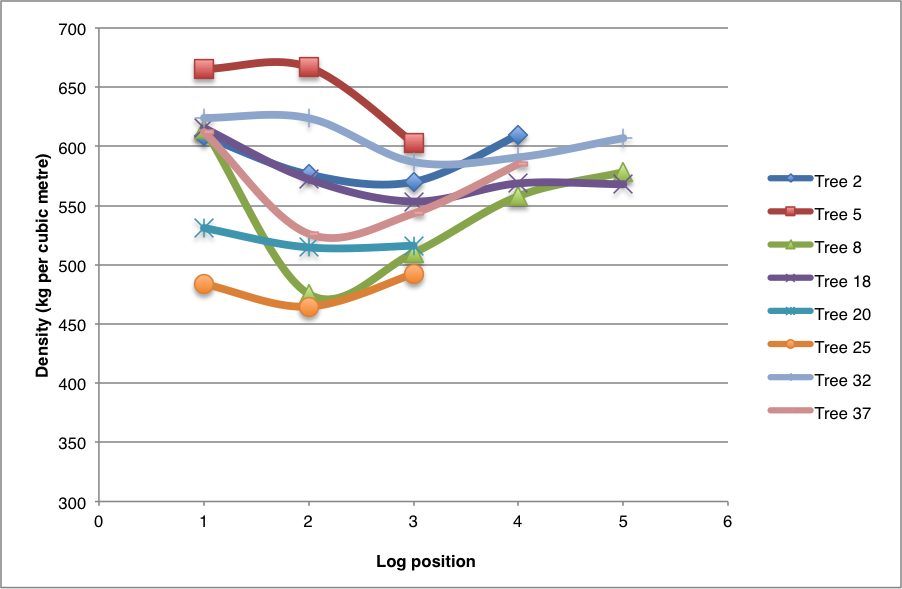
A single board sample collected from longitudinal mid-position from each log was tested for basic density. The relationship between density at test (average 11.77% moisture content) and log position is presented in Figure 16. Statistically significant differences were found between log 1 and logs 2 and 3 with a P value for log position of 0.013.
Density at test according to log position from single sample tests.
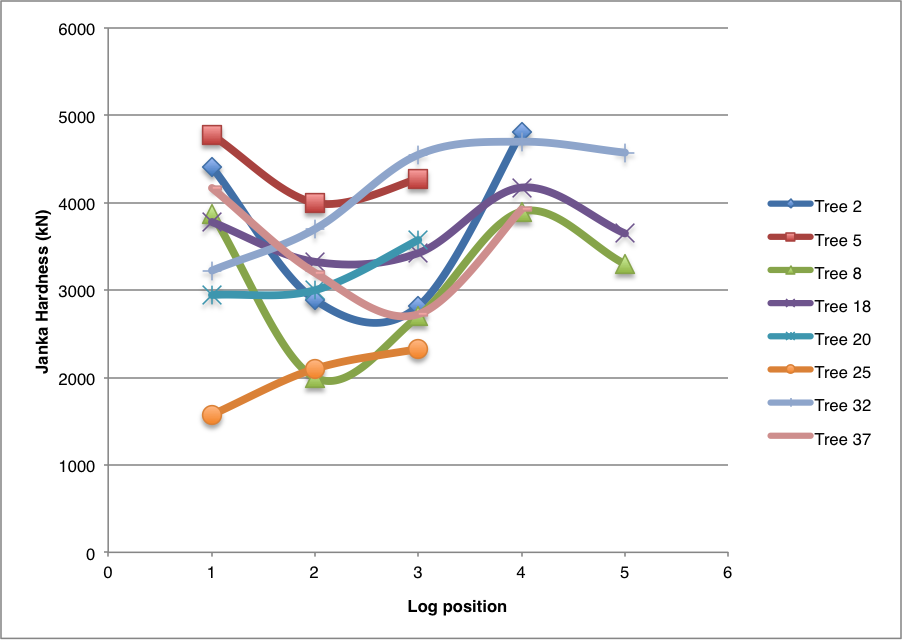
The test samples were also tested for hardness. The relationship between hardness and log position is presented below. Statistically significant differences were found between log 1 and log 2 with a P value for log position of 0.0122, suggesting lowest hardness in boards from log 2.
Hardness according to log position from single sample tests.
Log densities estimated from weighted and summed kiln-dried board weights are presented according to tree and log position below. The trend is for boards from the second log to have the lowest density, with increasing density from the second log to the fifth log. The fifth log was significantly denser than log 1 (P=0.0006), whereas logs 2 (P<0.0001) and 3 (P=0.0002) were significantly lower density than log 1. No significant difference in density was evident between log 1 and log 4 (P=0.7).
Density for each log per cubic metre.
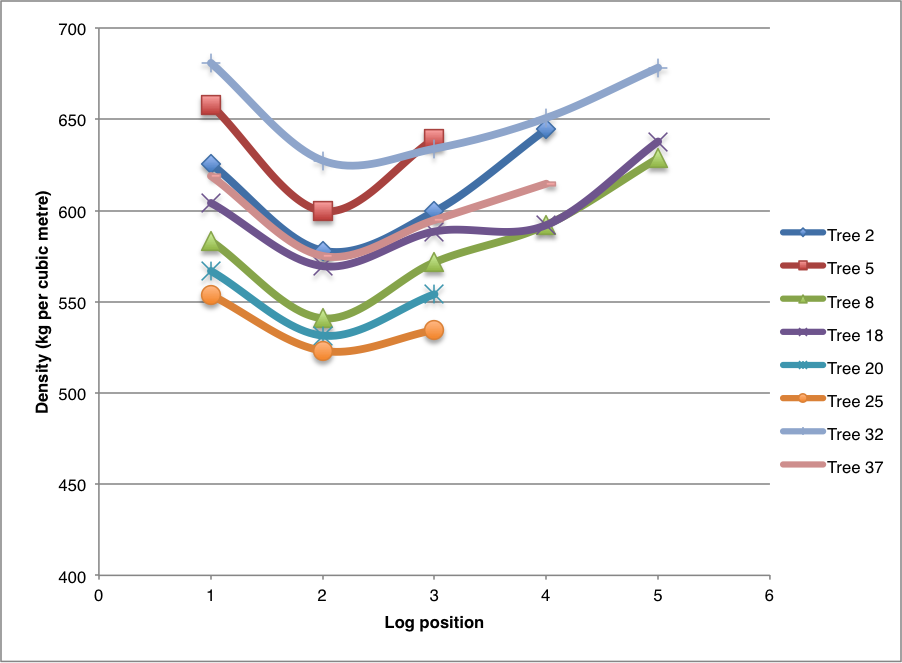
Single sample hardness values correlate well with single sample density values (0.79) and individual log densities (0.74) suggesting that hardness is likely to follow the same trend as density.
Movement in service
Long-term movement in service was tested from the single board test samples from each log. The relationship between movement in service and log position is presented below. The null hypothesis that there are no differences between movement in service in boards from log 1 and all other log positions can be rejected (P=0.0247), suggesting that movement in service is higher in log 1 than in log positions above this. There are no significant differences between log positions above log 1.
Long term movement in service according to log position.
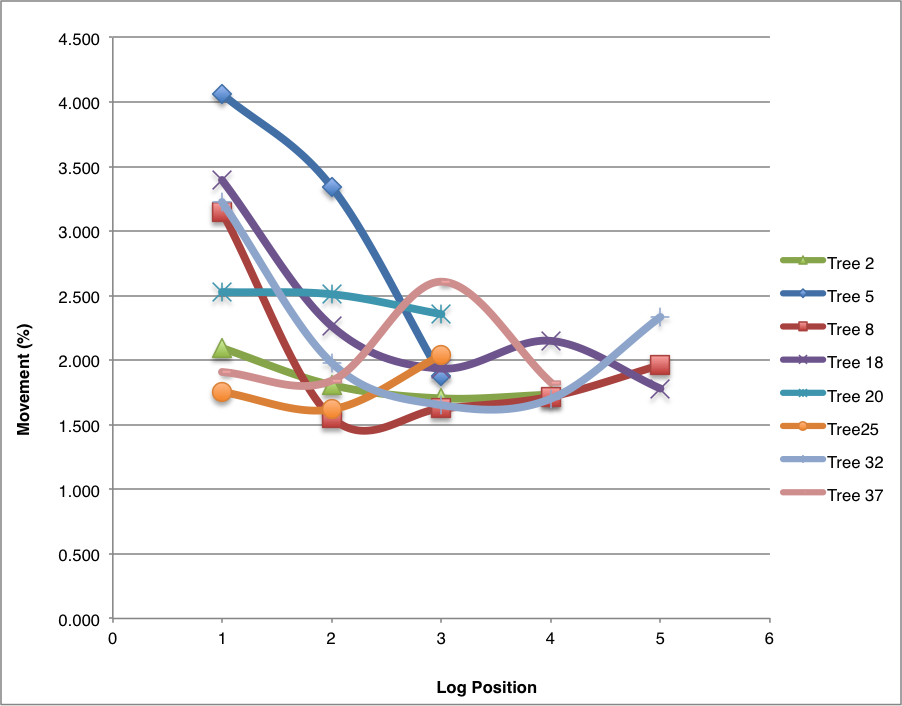
Movement in service from single samples also held a strong relationship with density from the same samples (P=0.001). However, by removing log 1 from the dataset the relationship was no longer significant to the 5% level (P=0.0611), suggesting that as density increases with height in the tree, movement in service might not.
Defect and drying degrade
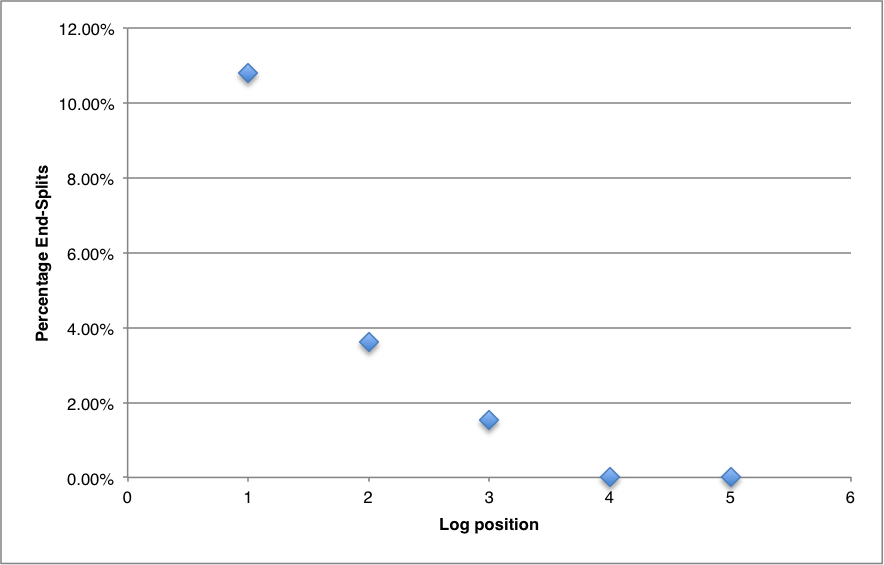
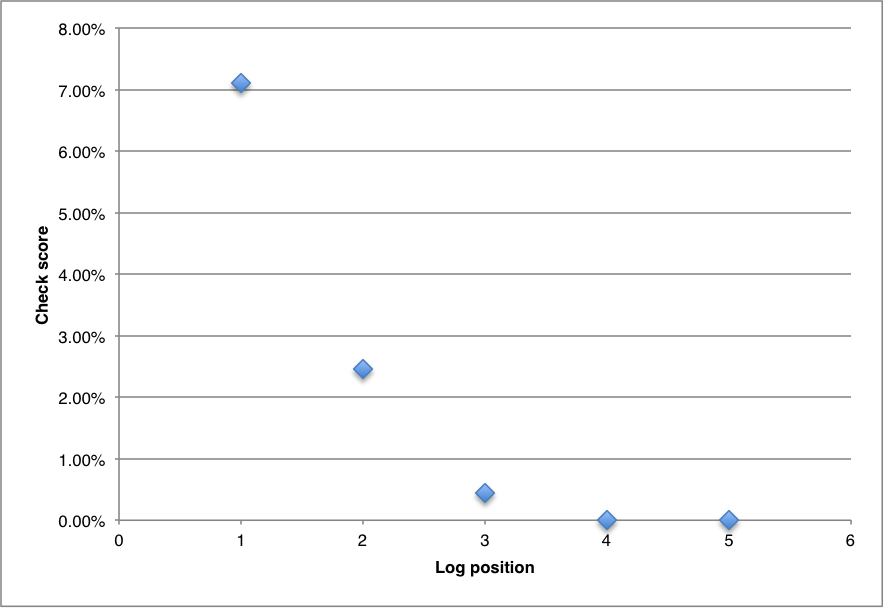
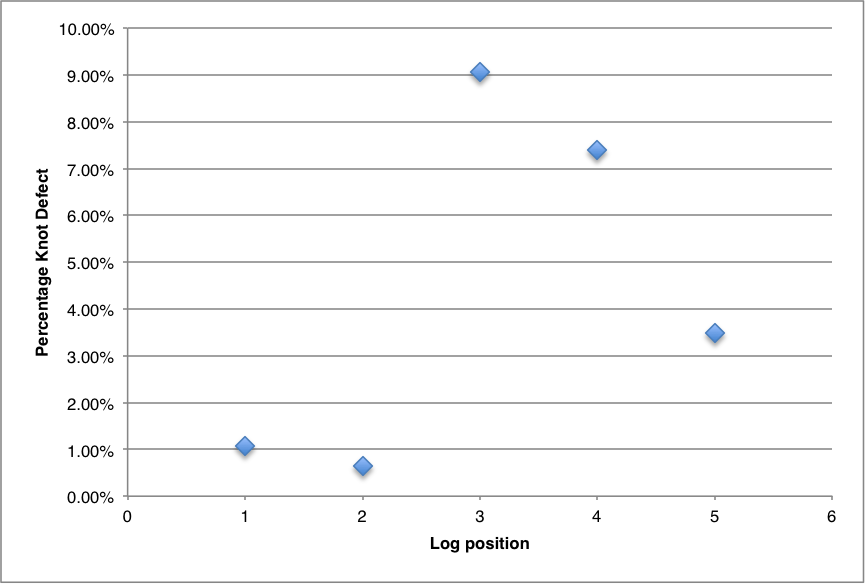
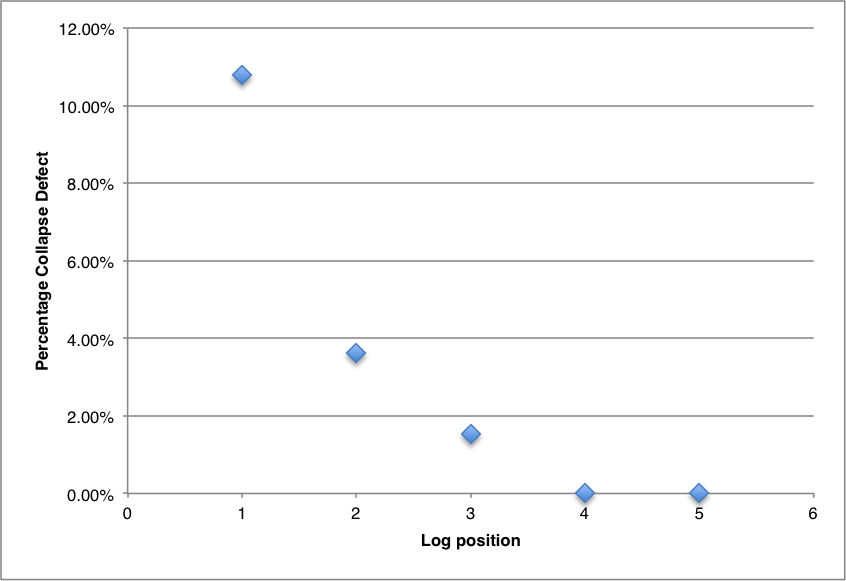
Log position was found to be important in determining levels of defect and drying degrade. The five figures below present percentages of defect levels from all sample boards according to log position.
Level of end-splits present in boards according to log position.
Surface check levels on profiled product as a score.
Percentage of knot defect in all boards, graded to Australian Standards.
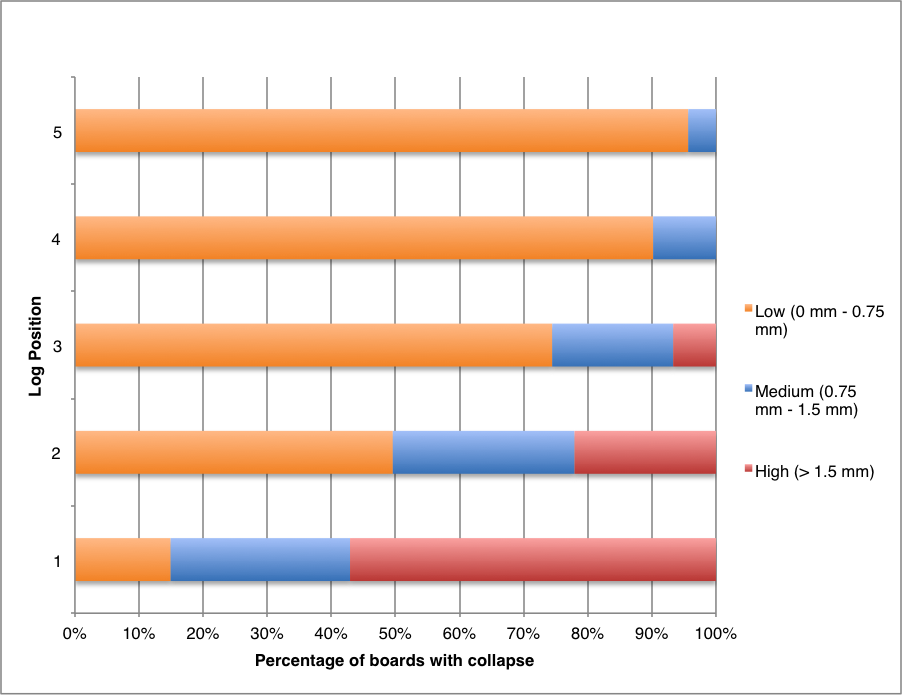
Percentage of board volume as defect caused by collapse.
Levels of collapse on un-reconditioned kiln-dried boards.
Next: Discussion »
Disclaimer: The opinions and information provided in this report have been provided in good faith and on the basis that every endeavour has been made to be accurate and not misleading and to exercise reasonable care, skill and judgement in providing such opinions and information. The Author and NZFFA will not be responsible if information is inaccurate or not up to date, nor will we be responsible if you use or rely on the information in any way.