Kawa poplar timber - properties and market opportunities
Acknowledgements: Many thanks to the MPI Hill Country Erosion Programme for supporting Northland Regional Council to achieve improved soil conservation outcomes and build our technical capacity.
Results
Trees and logs
Heartwood content
As height in tree increased, percentage of heartwood decreased (Figure 1).
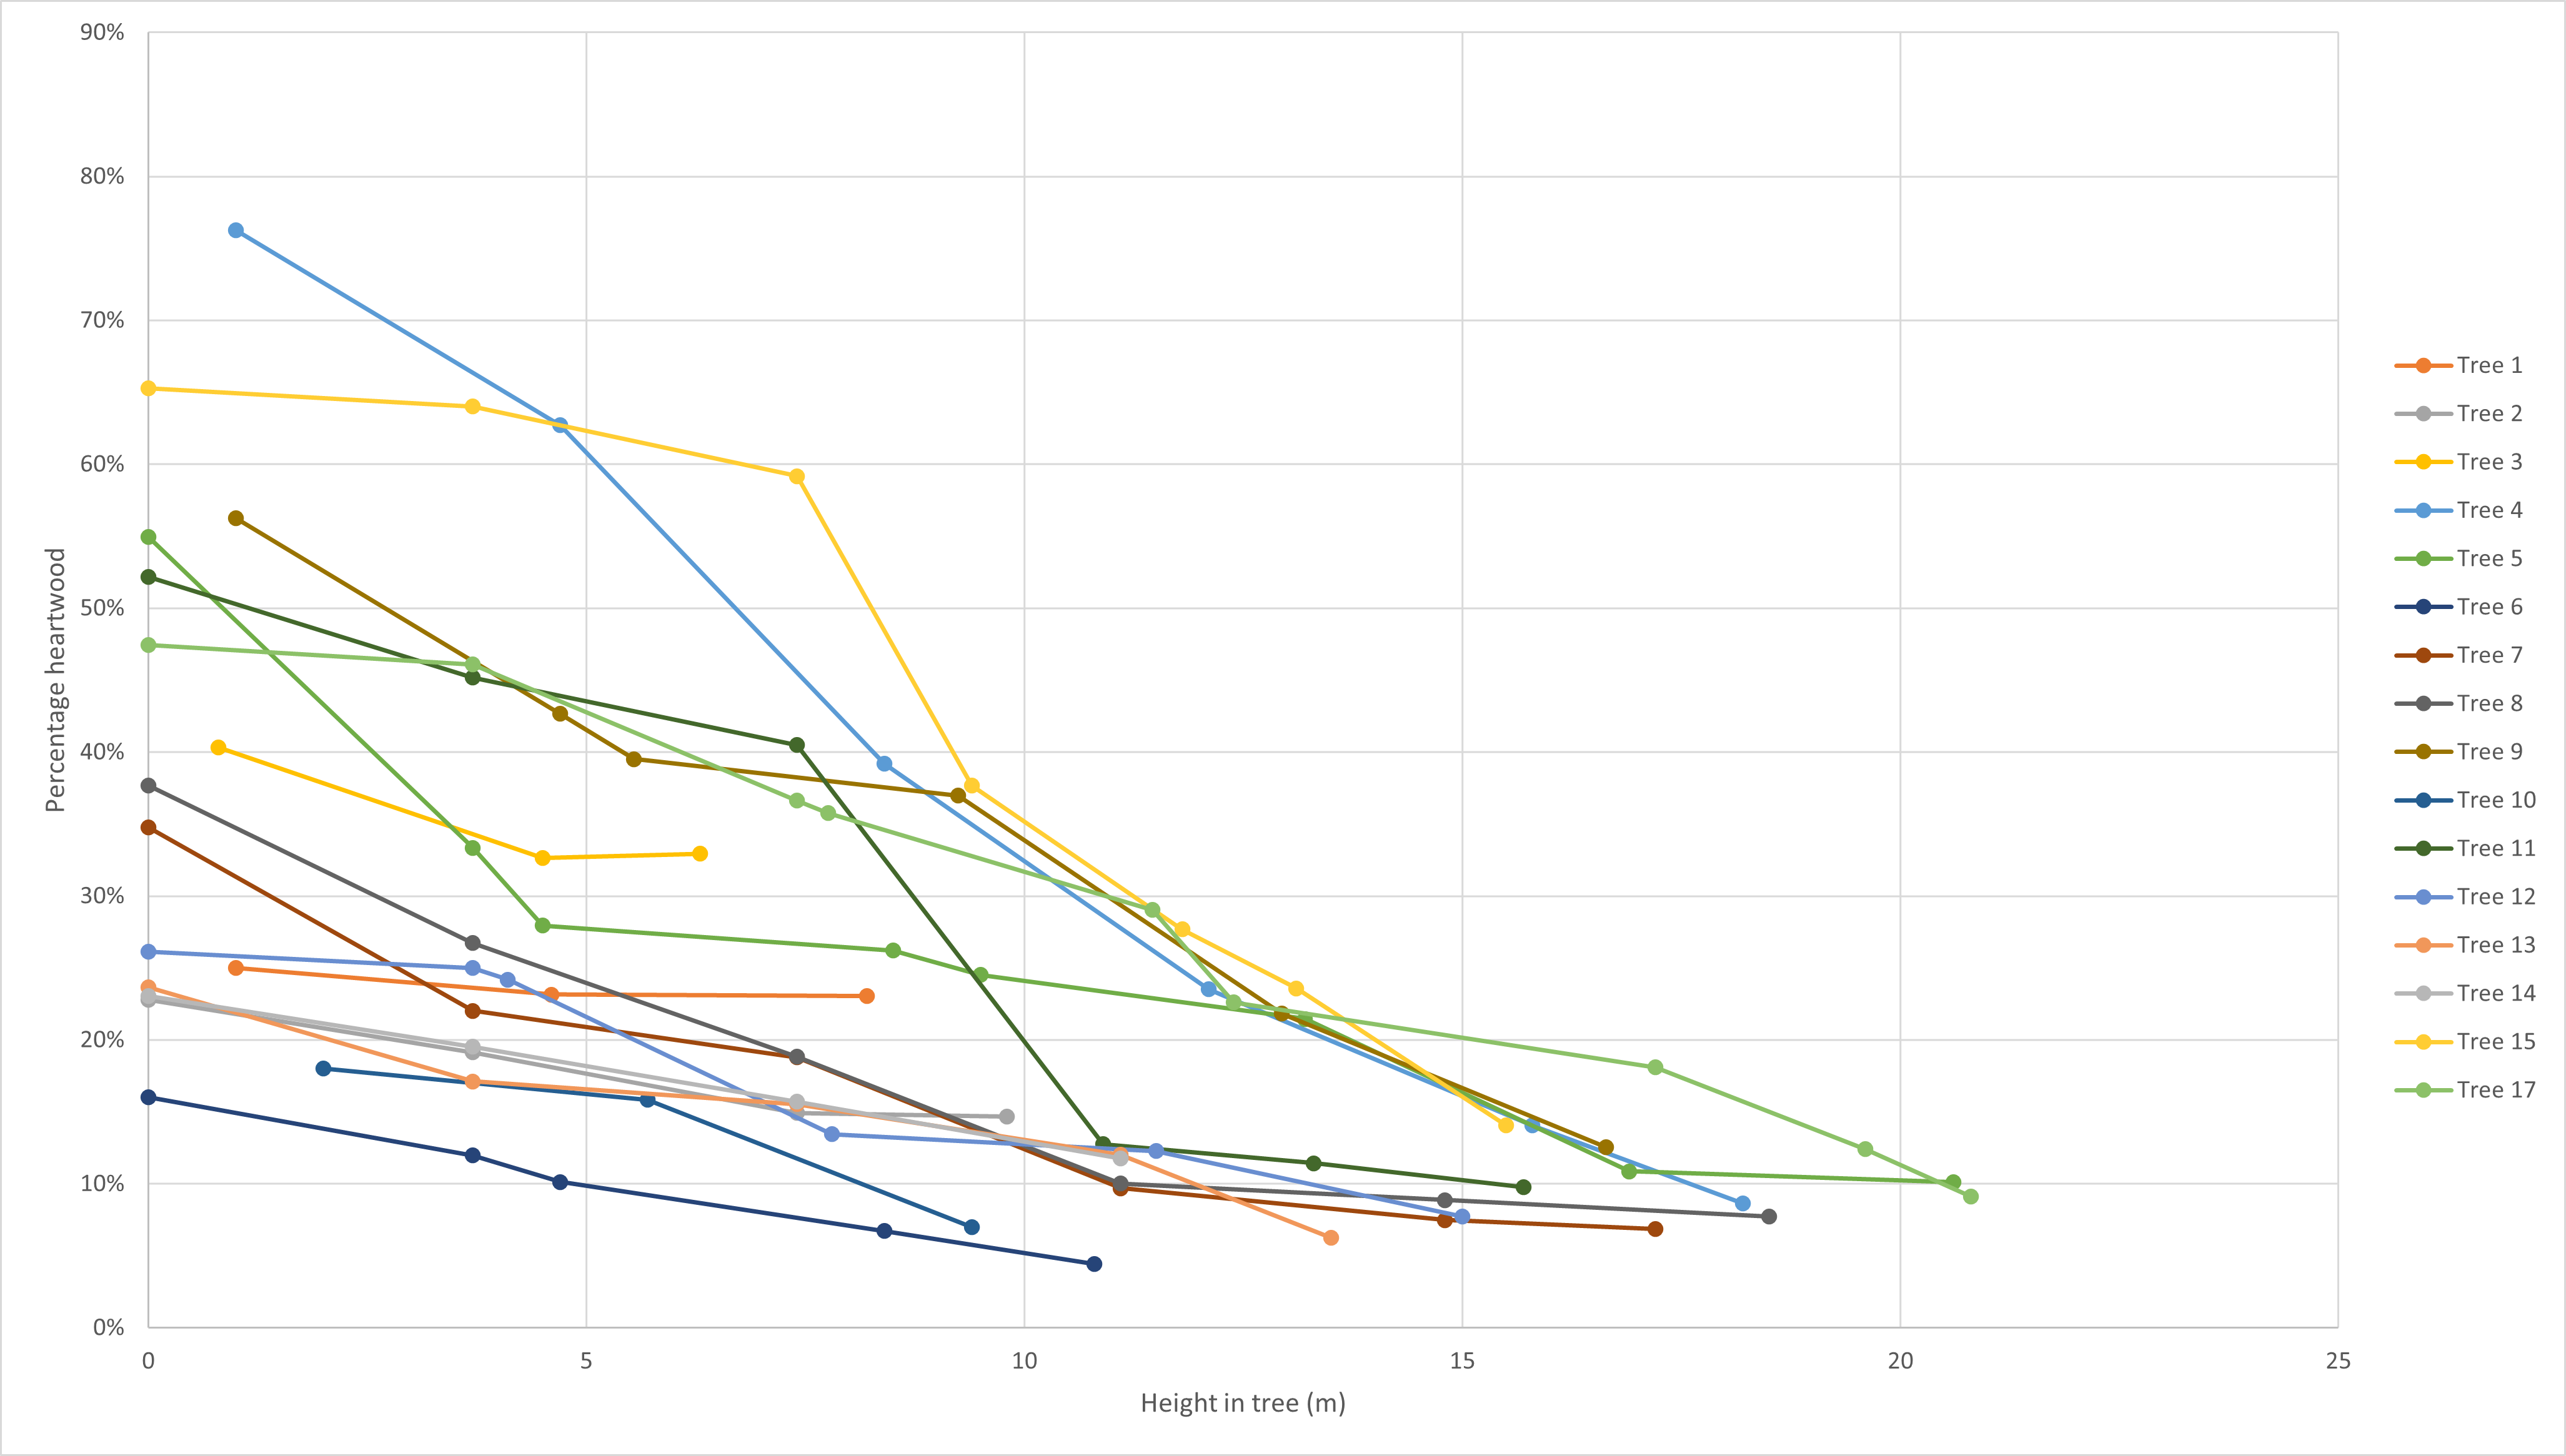
Figure 1: Heartwood percentage according to tree height for 16 trees.
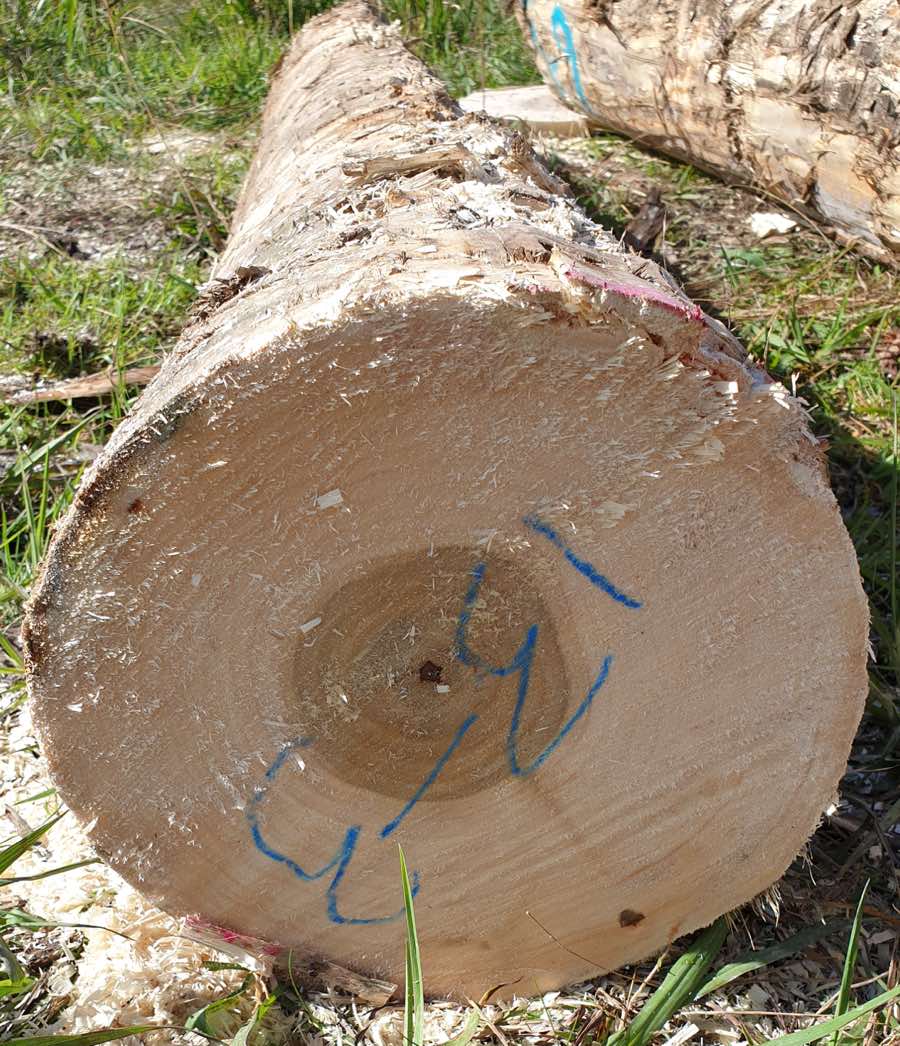
Typically low heartwood content for 28-year-old Kawa poplar headlogs
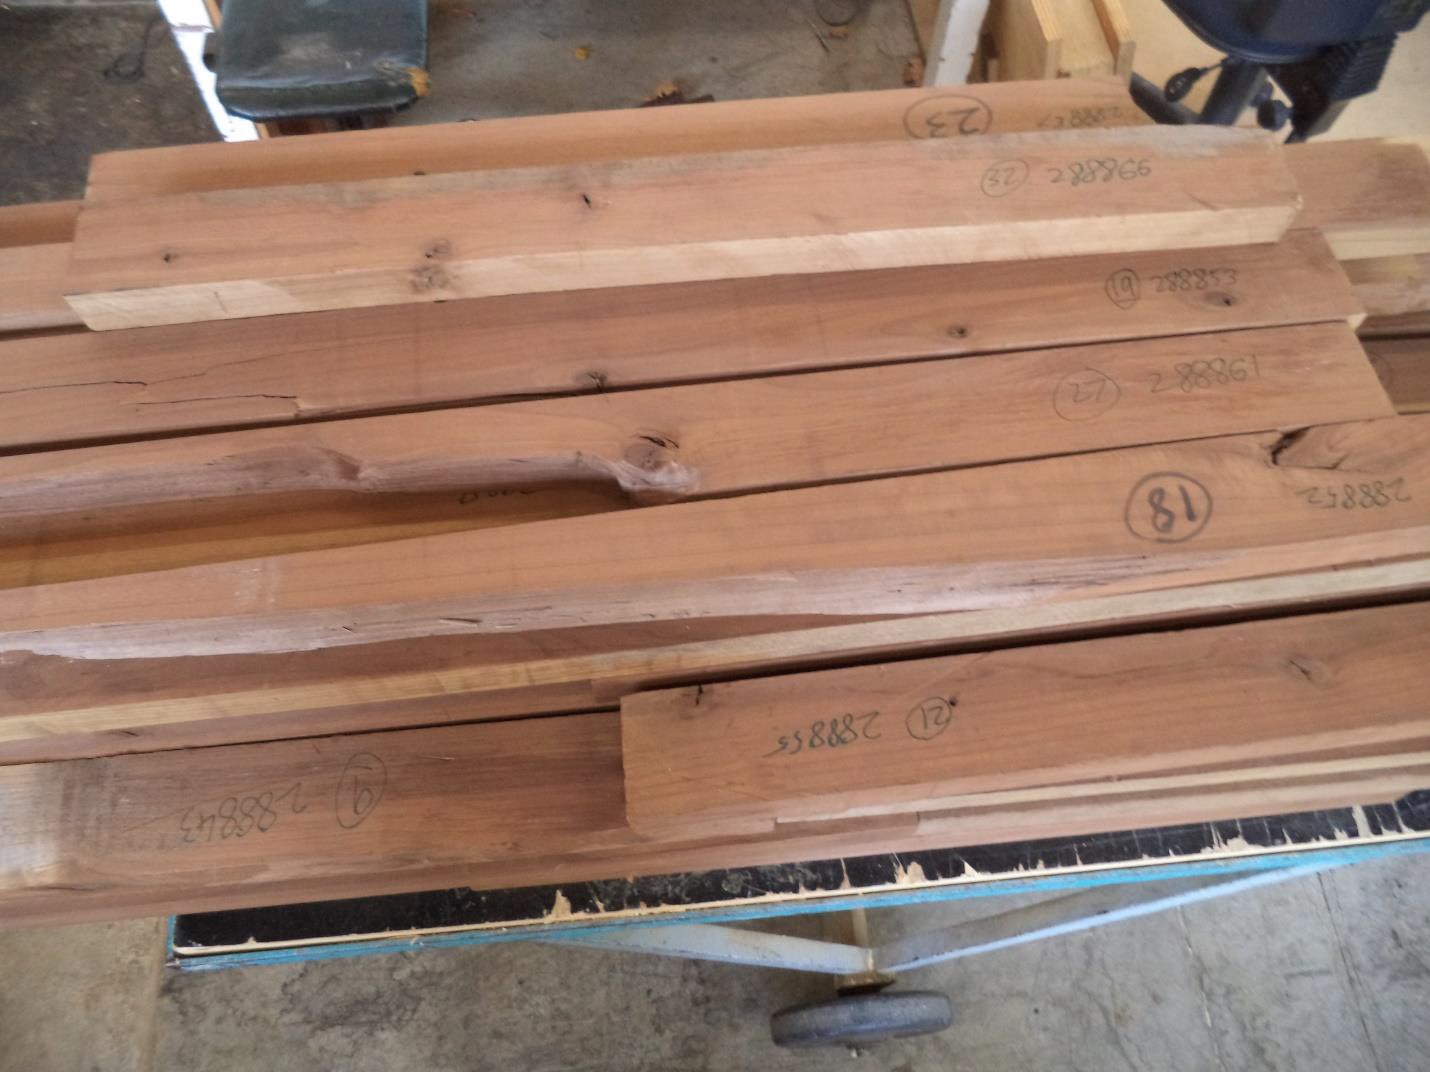
Sawn timber testing
Sawn timber recovery
The 43 logs that were processed had a total volume of 14.2 m3. These logs were processed into 7.6 m3 of nominal sized sawn boards, yielding 53% conversion to sawn timber.
There was a statistically significant (P= 0.00015) trend for increased sawn timber recovery as log diameters increased (Figure 2).
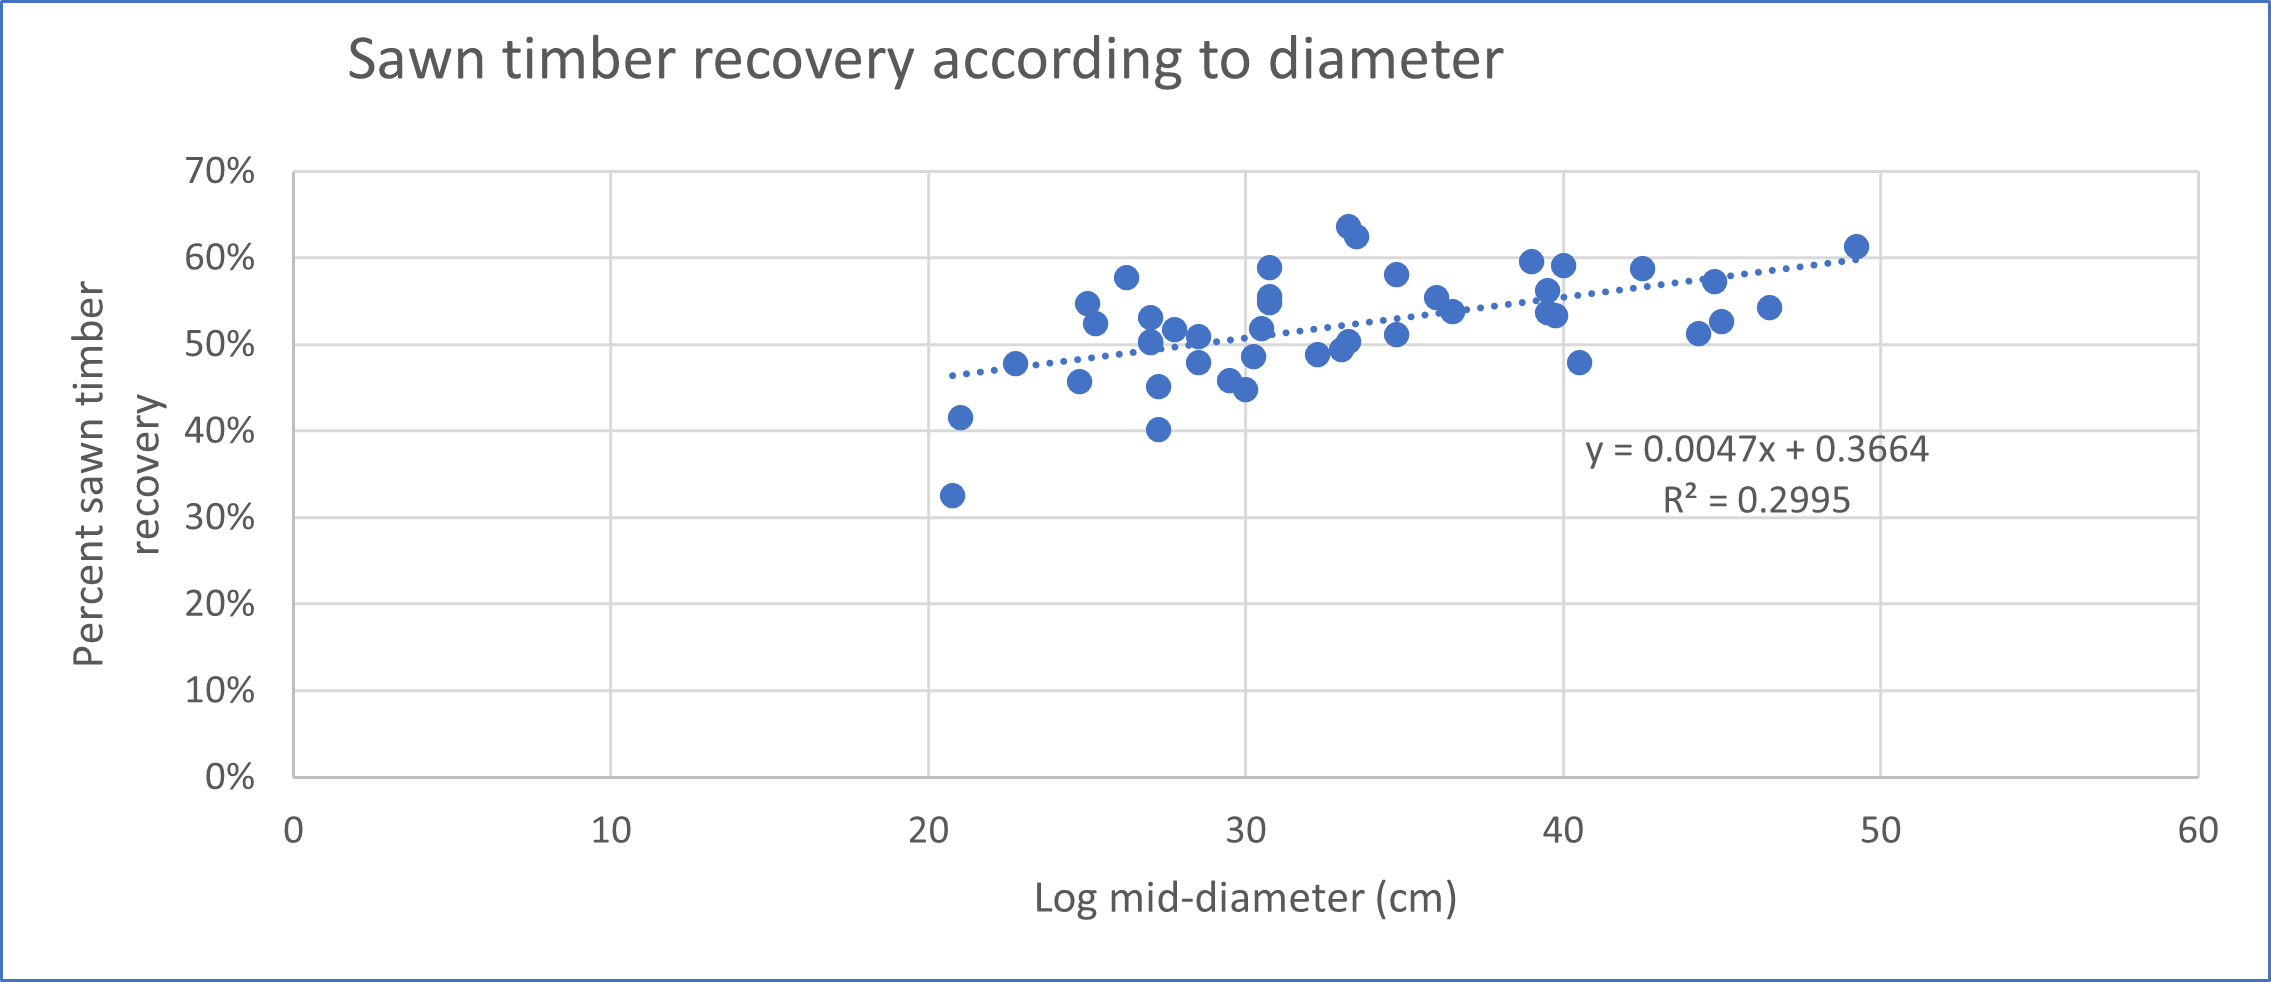
Figure 2: Sawn timber recovery according to diameter
Grade recoveries
Recovery of graded timber was 93.9% based on the “best grade” method (Table 2), with graded board length averaging 2.6m (Table 4). End splits and knot/pruning defects were the most significant cause of degrade. Under the “long-length” grading method, recovery of graded timber increased to 94.7% due to a reduction in degrade due to knots and pruning wounds (Table 2), with graded board length averaging 2.8m (Table 4).
| Outturn category | Percentage of sawn timber in category by grading method | |
|---|---|---|
| "Best" | "Long length" | |
| Graded timber | 93.9 | 94.7 |
| Defect - End splits | 2.4 | 2.4 |
| Defect - Knots and pruning wounds | 3.2 | 2.4 |
| Defect - Crook and bow | 0.5 | 0.5 |
| Defect - Pith | <0.1 | <0.01 |
| Total | 100 | 100 |
The volume docked due to knots and pruning wounds was broken down into different categories, which showed that the most common downgrade was due to large spike knots, followed by large knots and then pruning wounds (Table 3).
| Knot/pruning wound defect category | Percent total volume |
|---|---|
| Large knot defect | 20% |
| Large spike knot defect | 33% |
| Knot degrade | 12% |
| Spike knot degrade | 3% |
| Large pruning wound defect | 12% |
| Pruning wound degrade | 19% |
| Total | 100% |
Most of the recovered timber volume was assigned to the “clears” grade (Table 4). Under the “best grade” method, 74% of the recovered volume was assigned to the “clears” grade with the average length of clear sections being 2.5 m (range 0.7-4.0 m).
The proportion of recovered volume assigned to the clears grade decreased from 74% for the "best grade" method to 64% for the "long length" grading method, but the average length of clear sections increased from 2.52m for "best grade" method to 2.6m for "long length" grade method. The "long length" method resulted in greater proportions of recovered volume being assigned to the cladding and structural grades, and the average board lengths for these grades being 0.3 m and 0.5 m longer, respectively, than under the “best” grading method (Table 4).
| Grade | "Best" grading method | "Long length" grading method | ||
|---|---|---|---|---|
| Grade recovery (%) | Average board length (m) | Grade recovery (%) | Average board length (m) | |
| Clears | 74 | 2.52 | 64 | 2.6 |
| Cladding | 17 | 2.96 | 23 | 3.3 |
| Structural | 9 | 2.71 | 13 | 3.2 |
| Overall | 100 | 2.6 | 100 | 2.8 |
Strength and stiffness
Characteristic values - Ingrade solid timber Kawa
The characteristic values of modulus of elasticity and modulus of rupture were 10.58 GPa and 45.90 MPa, respectively (Table 5), which were sufficient for the timber to be assigned to the SG10 strength class. The bending strength exceeded the requirement for higher strength classes, with the assignment to SG10 determined by bending stiffness (modulus of elasticity). Scion's report is available here »
| Bending Stiffness MoEj (GPa) | Bending Strength MoRj (MPa) | Density at Test kg/m3 | Nominal Density kg/m3 | |
| Mean | 10.76 | 59.13 | 475.93 | 429.73 |
| Minimum | 6.88 | 33.37 | 395.15 | 358.13 |
| Maximum | 13.04 | 74.34 | 566.88 | 511.2 |
| Range | 6.16 | 40.97 | 171.74 | 153.08 |
| Standard Deviation | 1.33 | 11.25 | 35.96 | 32.36 |
| Coefficient of Variation | 12.38% | 19.02% | 7.56% | 7.53% |
| Count | 31 | 31 | 31 | 31 |
| Characteristic Strength (MPa) | 45.09 | |||
| Characteristic Stiffness (GPa) | 10.58 | |||
| Characteristic Density at Test (kg/m3) | 471.2 | |||
| Characteristic Nominal Density (kg/m3) | 425.7 | |||
| Assigned Grade | SG10 | SG10 |
| Moisture Content % |
Density at Test kg/m3 |
Nominal Density kg/m3 |
|
|---|---|---|---|
| Mean | 10.75 | 475.93 | 429.73 |
| Minimum | 8.73 | 395.15 | 358.13 |
| Maximum | 12.13 | 566.88 | 511.20 |
| Range | 3.40 | 171.74 | 153.08 |
| Standard Deviation | 0.65 | 35.96 | 32.36 |
| Coefficient of Variation | 6.04% | 7.56% | 7.53% |
| Count | 31 | 31 | 31 |
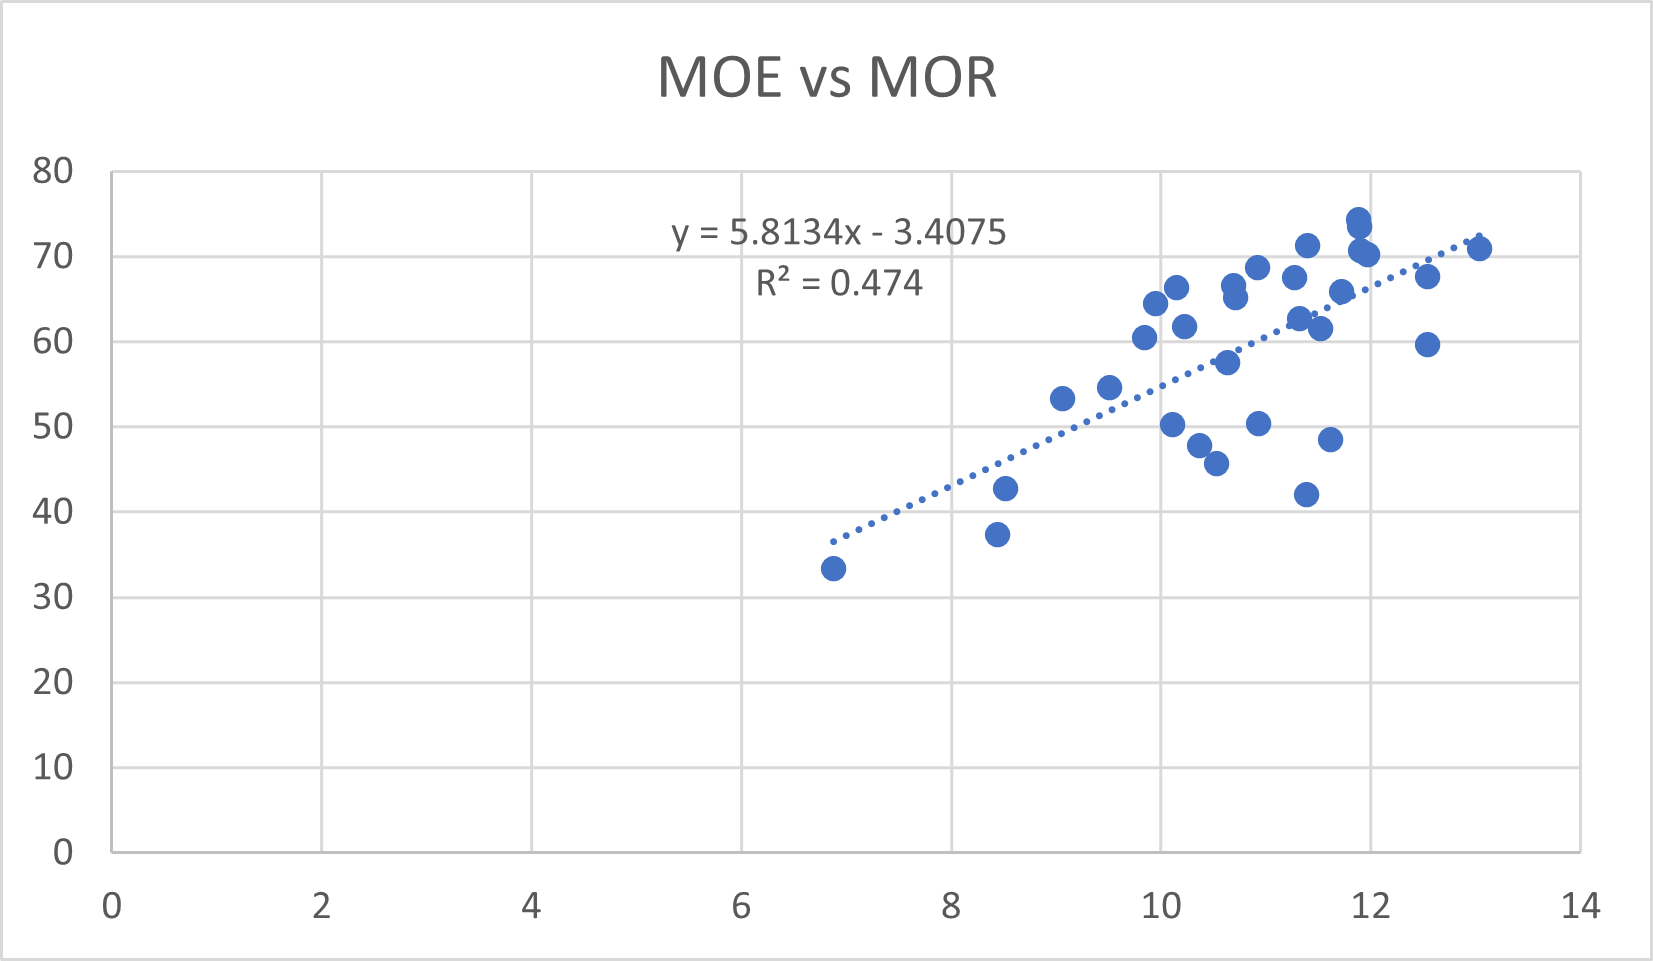
Figure 3: Modulus if elasticity vs modulus of rupture, No. 1 framing solid timber 90mm x 45mm.
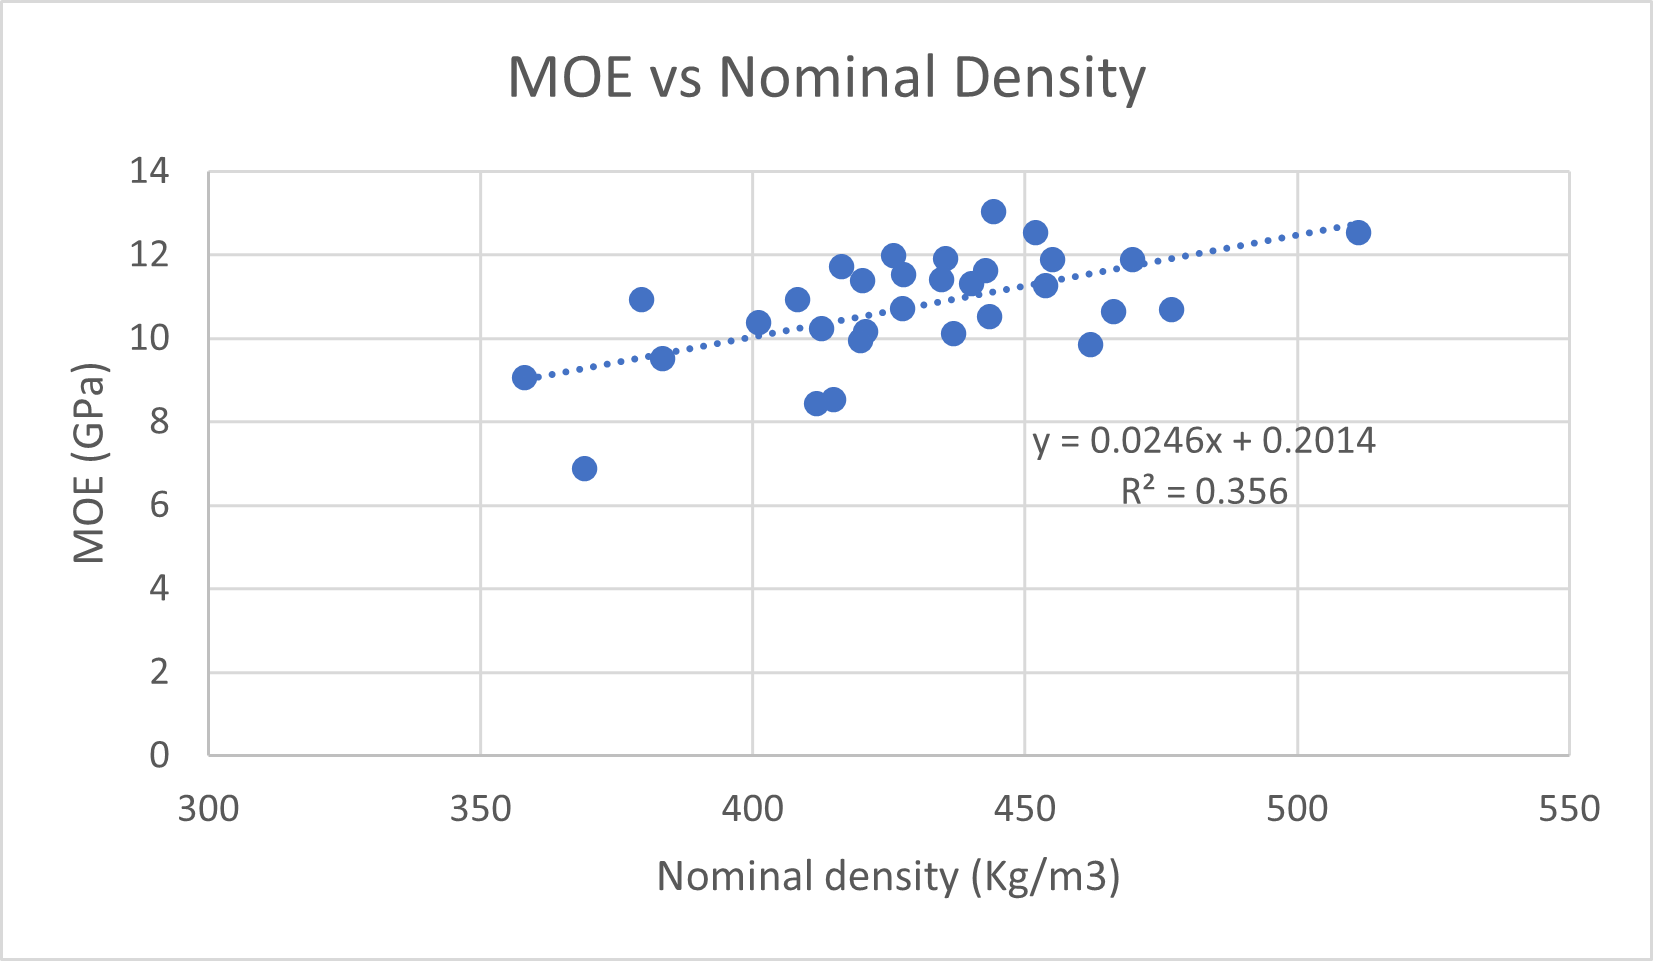
Figure 4: Modulus if elasticity vs density, No. 1 framing solid timber 90mm x 45mm
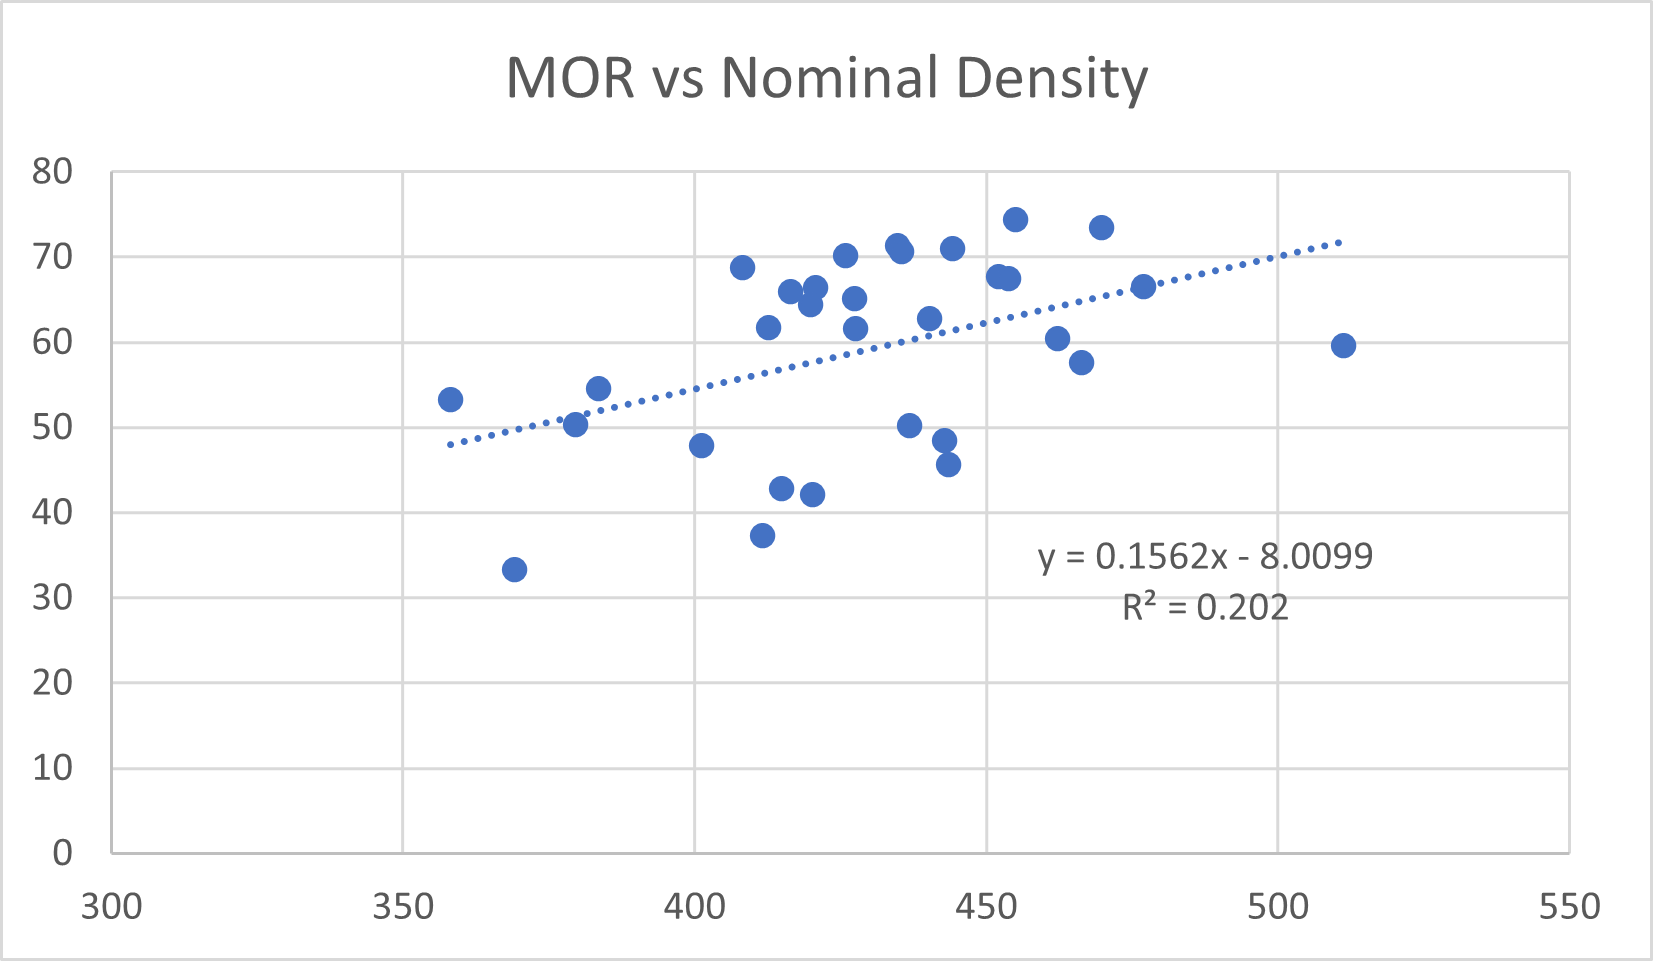
Figure 5: Modulus of rupture vs density, No. 1 framing solid timber 90mm x 45mm
Characteristic values - Clears glulam Kawa
The characteristic values for modulus of elasticity and modulus of rupture were 11.0 GPa and 32.6 MPa, respectively, which were sufficient for the timber to be assigned to the SG10 strength class. The bending strength exceeded the requirement for higher strength classes, with the assignment to SG10 determined by bending stiffness (modulus of elasticity). Scion's report is available here »
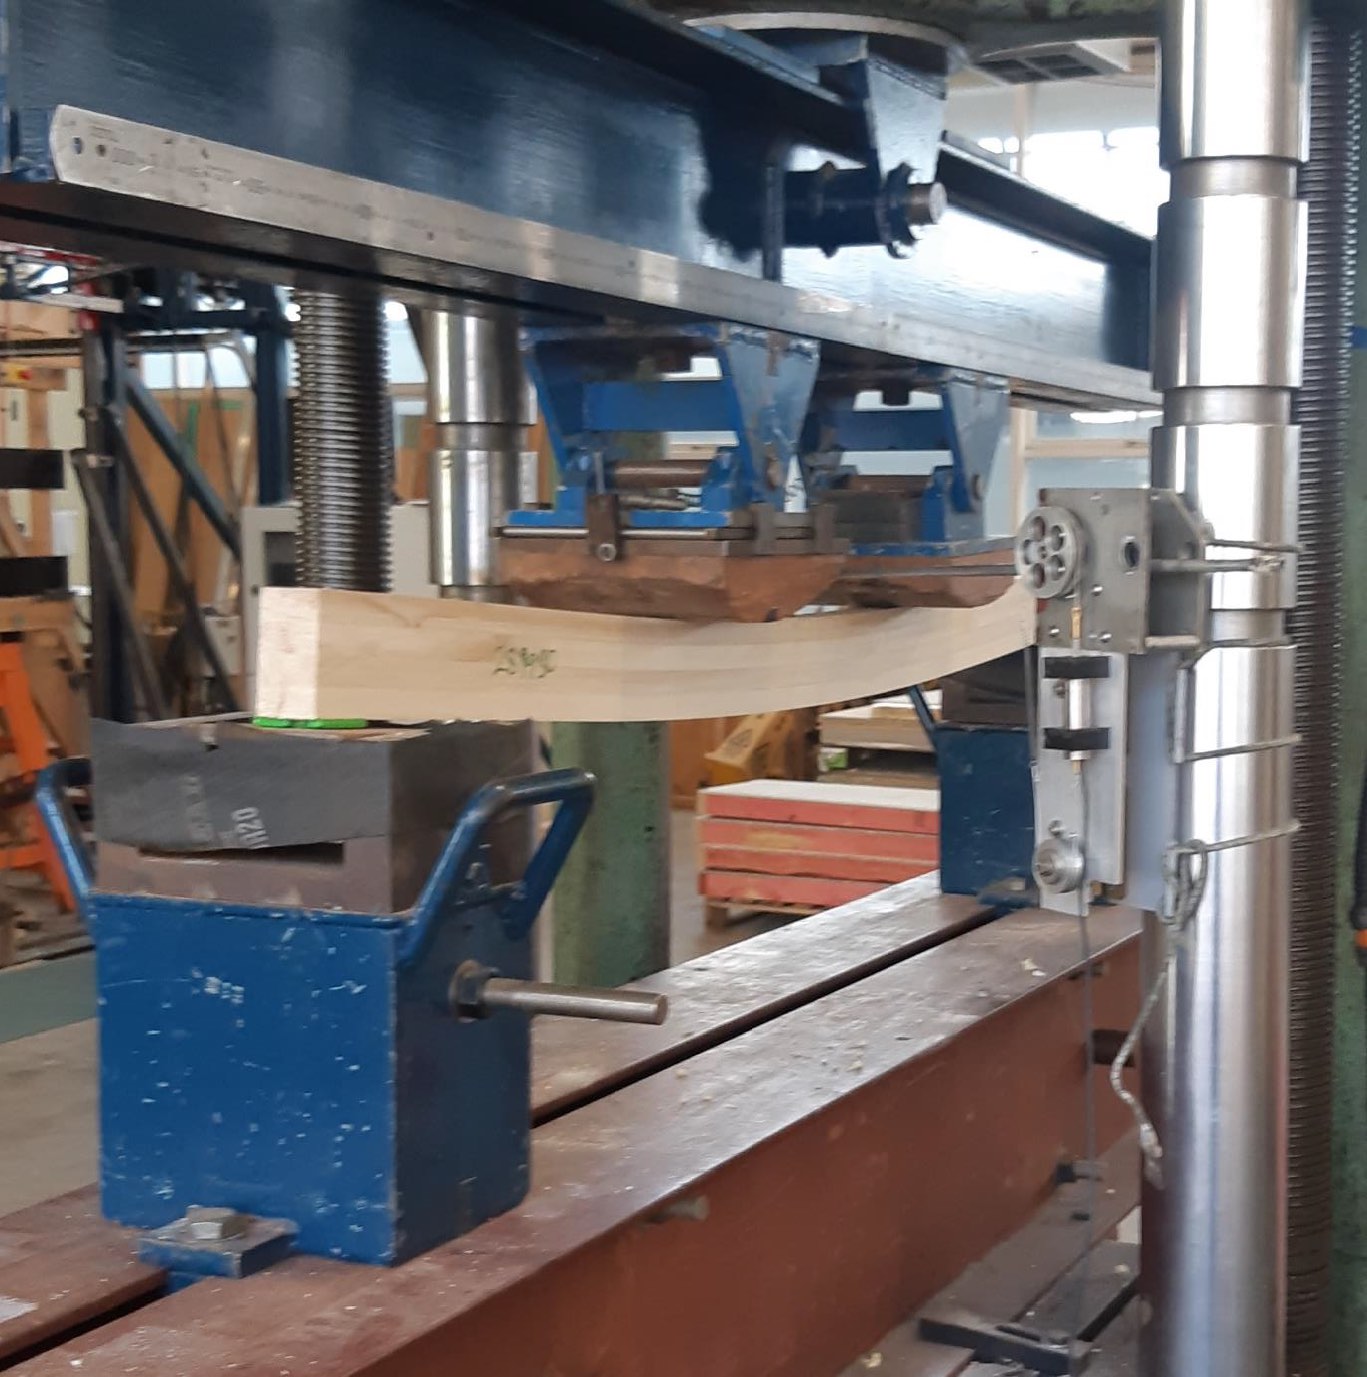
Kawa poplar glulam being tested, showing the four laminates making up the beam.
| Bending Stiffness MoEj (GPa) |
Bending Strength MoRj (MPa) |
Density at test (kg/m3) |
|
|---|---|---|---|
| Mean | 11.03 | 60.71 | 494.77 |
| Minimum | 9.71 | 21.27 | 443.77 |
| Maximum | 12.24 | 80.35 | 551.96 |
| Range | 2.53 | 59.08 | 108.19 |
| Standard Deviation | 0.60 | 15.01 | 24.72 |
| Coefficient of Variation | 5.47% | 24.72% | 5.00% |
| Count | 32 | 32 | 32 |
| Characteristic Strength (MPa) | 32.6 | ||
| Characteristic Stiffness (GPa) | 11.0 | ||
| Characteristic Density at Test (kg/m3) | 491.7 | ||
| Assigned Grade | GL10 | GL12 |
| Moisture Content % |
Density at Test kg/m3 |
Nominal Density kg/m3 |
|
|---|---|---|---|
| Mean | 12.73 | 494.77 | 438.91 |
| Minimum | 11.56 | 443.77 | 392.77 |
| Maximum | 17.37 | 551.96 | 490.43 |
| Range | 5.81 | 108.19 | 97.66 |
| Standard Deviation | 0.95 | 24.72 | 21.43 |
| Coefficient of Variation | 7.47% | 5.00% | 4.88% |
| Count | 32 | 32 | 32 |
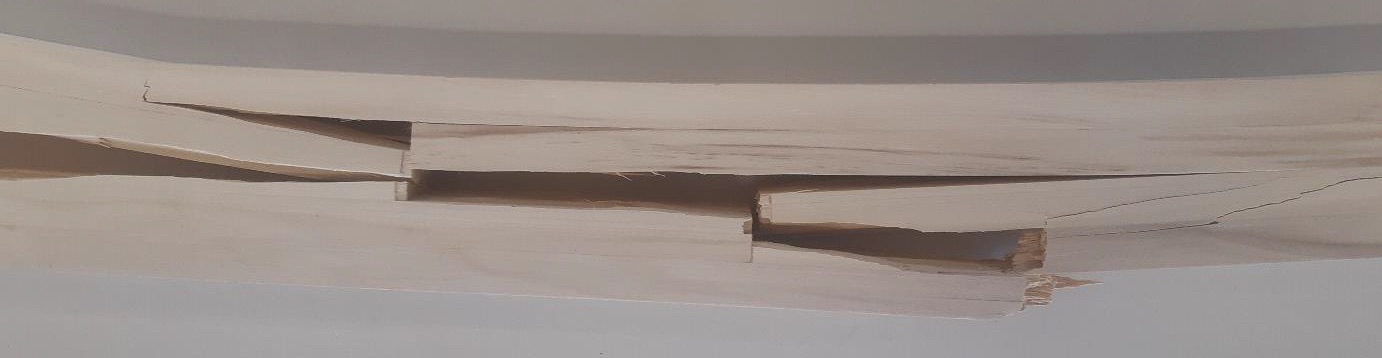
Typical failure starting with Finger-joint failure on tension edge then progressing through the inner finger-joints. This beam had a MoE of 10.86 GPa and MoR of 71.46 MPa.
Failure starting with Finger-joint failure on tension edge. This beam had a MoE of 10.78 GPa and MoR of 31.92 MPa.
Typical Tension failure in Clearwood also with compression wrinkle in Clearwood. This beam had a MoE of 11.25 GPa and MoR of 76.81 MPa.
Characteristic values - Ingrade thermally modified Kawa
The characteristic values of modulus of elasticity and modulus of rupture were 9.23 GPa and 9.33 MPa, respectively. Although characteristic stiffness (9.23 GPa) was sufficient for a grade of SG8, characteristic bending strength of 9.33 MPa was not sufficient for a grade of SG 6 (a requirement of 10 MPa). No. 1 framing grade Thermowood 230 poplar did not have sufficient strength to be assigned to a SG strength class. Scion's report is available here »
Thermally modified Kawa poplar samples after testing.
| Bending Stiffness MoEj (GPa) |
Bending Strength MoRj (MPa) |
Density at test (kg/m3) |
|
|---|---|---|---|
| Mean | 9.35 | 26.67 | |
| Minimum | 6.89 | 10.18 | |
| Maximum | 10.60 | 58.08 | |
| Range | 3.71 | 47.90 | |
| Standard Deviation | 0.89 | 11.77 | |
| Coefficient of Variation | 9.51% | 44.13% | |
| Count | 29 | 30 | |
| Characteristic Strength (MPa) | 9.33 | ||
| Characteristic Stiffness (GPa) | 9.23 | ||
| Characteristic Density at Test (kg/m3) | 386.8 | ||
| Assigned Grade | SG8 | Reject |
| Moisture Content % |
Density at Test kg/m3 |
Nominal Density kg/m3 |
|
|---|---|---|---|
| Mean | 5.70 | 389.19 | 368.19 |
| Minimum | 5.24 | 343.60 | 325.20 |
| Maximum | 6.32 | 437.42 | 412.57 |
| Range | 1.09 | 93.82 | 87.37 |
| Standard Deviation | 0.22 | 26.14 | 24.68 |
| Coefficient of Variation | 3.80% | 6.72% | 6.70% |
| Count | 30 | 30 | 30 |
Small clears testing
Modulus of elasticity of the 140 small, defect-free specimens tested ranged from 5.65 GPa up to 11.17 GPa, with a mean of 9.02 GPa. Modulus of elasticity was significantly higher in specimens cut from the outer position in a log and increased with log position up the stem, with the difference in modulus of elasticity between specimens cut from the inner and outer positions greatest in the butt log. Modulus of rupture and nominal density also exhibited similar within-tree patterns of radial and longitudinal variation.
H1.2 Boron preservative trials
Retention and penetration - water-based diffusion
Boric acid equivalent (BAE) test results ranged from 0.60% (m/m) up to 1.98%, with a mean of 1.03%. These values all exceeded the threshold of 0.40%, which meant that all sixteen samples passed the H1.2 boron retention requirements as per NZS 3640:2003. The samples tested achieved full cross section retention of the preservative, not just retention in the sapwood zone. All samples also passed the penetration spot test as per NZS 3640:2003.
| Sample | Penetration spot test | Retention analysis BAE %m/m (critical level 0.4000) | Retention analysis outcome |
|---|---|---|---|
| 7-1-1 | Pass | 1.03 | Pass |
| 7-1-2 | Pass | 1.15 | Pass |
| 13-2-1 | Pass | 0.87 | Pass |
| 16-1-1 | Pass | 0.72 | Pass |
| 17-1-1 | Pass | 1.12 | Pass |
| 7-1-1 | Pass | 0.88 | Pass |
| 7-1-2 | Pass | 0.95 | Pass |
| 9-1-1 | Pass | 0.76 | Pass |
| 9-1-2 | Pass | 0.60 | Pass |
| 11-2-1 | Pass | 0.91 | Pass |
| 11-2-2 | Pass | 1.10 | Pass |
| 4-1-1 | Pass | 0.93 | Pass |
| 14-1-1 | Pass | 1.98 | Pass |
| 4-3-1 | Pass | 0.85 | Pass |
| 17-1-2 | Pass | 1.65 | Pass |
| 15-2-1 | Pass | 0.97 | Pass |
Retention and penetration - Monoethanolamine-based diffusion
Boric acid equivalent (BAE) test results ranged from 0.37% (m/m) up to 0.65%, from this small sample size.
| Sample | Penetration spot test | Retention analysis BAE %m/m (critical level 0.40) | Retention analysis outcome |
|---|---|---|---|
| BAX 9-1-1 dressed 90x45 | Pass | 0.41 | Pass |
| BAX 9-1-2 dressed 90x45 | Pass | 0.37 | Fail |
| BAX 9-1-3 not dressed 100x50 | Pass | 0.54 | Pass |
| BAX 17-1-2 not dressed 100x50 | Pass | 0.65 | Pass |
Durability performance - Scion Framing Trial
Scion produced a 12-month durability performance exposure report: The decay resistance of Poplar in an accelerated framing test: The condition of samples after 12 months exposure.
| Group and treatment | Mycelium (Lower rating is better) |
Decay - Surface (Higher rating is better) | Decay - Joint (Higher rating is better) | Mould (Lower rating is better) | ||||
|---|---|---|---|---|---|---|---|---|
| Op1 | Ax1 | Op | Ax | Op | Ax | Op | Ax | |
| Poplar, untreated | 2.9 | 3.3 | 8.6 | 6.2 | 8.7 | 6.8 | 3.1 | 2.9 |
| Poplar, boron treated | 1.0 | 1.0 | 10.0 | 10.0 | 10.0 | 10.0 | 1.7 | 1.7 |
| Radiata pine, untreated - Supplied from Northland | 4.7 | 4.5 | 9.2 | 6.0 | 8.9 | 5.4 | 2.5 | 2.7 |
| Radiata pine, untreated - Sourced from Central North Island | 4.1 | 3.4 | 7.9 | 7.7 | 8.2 | 7.6 | 3.2 | 3.0 |
| Radiata pine, boron treated | 1.0 | 1.0 | 10.0 | 10.0 | 10.0 | 10.0 | 2.0 | 2.1 |
1 Op and Ax represent different ends of the “I-frame” samples with feeder blocks inoculated with Oligoporous placenta and Antrodia xantha.
Scion produced a 24-month durability performance exposure report: The decay resistance of Poplar in an accelerated framing test: The condition of samples after 24 months exposure.
| Group and treatment | Mycelium (Lower rating is better) |
Decay - Surface (Higher rating is better) | Decay - Joint (Higher rating is better) | Mould (Lower rating is better) | ||||
|---|---|---|---|---|---|---|---|---|
| Op1 | Ax1 | Op | Ax | Op | Ax | Op | Ax | |
| Poplar, untreated | 4.4 | 4.5 | 1.2 | 0.6 | 0.8 | 0.4 | 4.6 | 4.1 |
| Poplar, boron treated | 1.1 | 1.1 | 10.0 | 10.0 | 10.0 | 10.0 | 1.6 | 2.0 |
| Radiata pine, untreated - Supplied from Northland | 5.7 | 5.0 | 0.4 | 0.4 | 0.4 | 0.6 | 2.4 | 3.1 |
| Radiata pine, untreated - Sourced from Central North Island | 5.6 | 3.9 | 1.3 | 3.2 | 0.6 | 2.6 | 4.3 | 4.3 |
| Radiata pine, boron treated | 1.3 | 1.0 | 10.0 | 10.0 | 10.0 | 10.0 | 2.6 | 3.0 |
1 Op and Ax represent different ends of the “I-frame” samples with feeder blocks inoculated with Oligoporous placenta and Antrodia xantha.
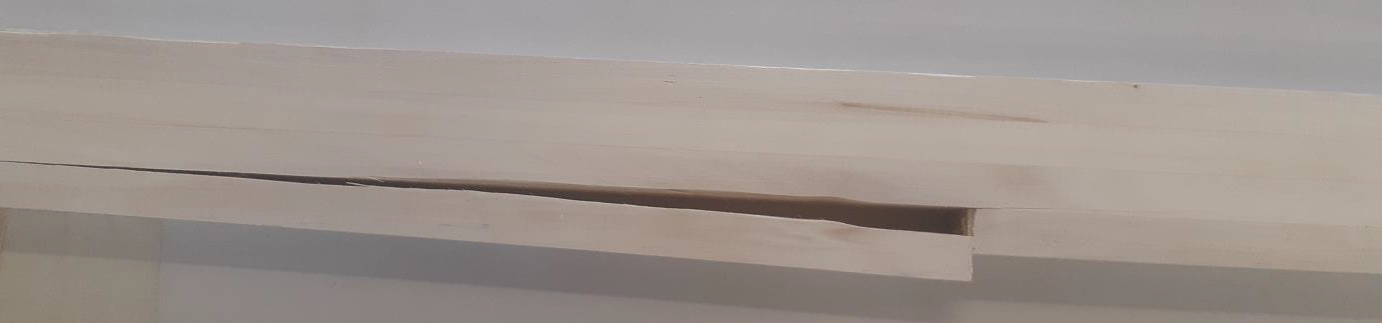
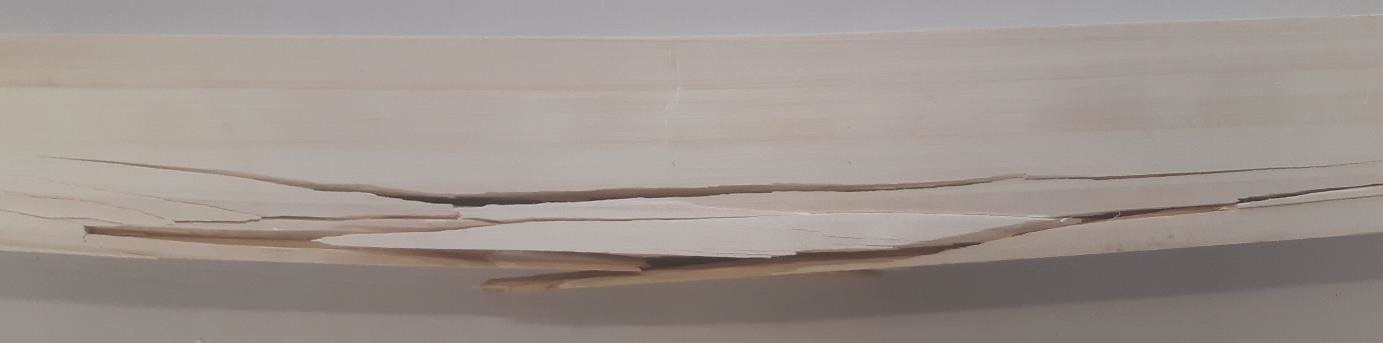
Thermal modification
Some distortion resulted from the thermal modification process. Crook and cupping were evident in some boards, especially in the 200mm wide boards. The 200 mm width boards cupped more than the 150mm width boards, sometimes as deep as 4-5mm from edge to edge. Distortion was severe around large knots, which required docking, that distortion often extending away from the knots and into the residual board. Knots tended to check severely, and these checks usually extended through the wood from one surface to the other.
Shrinkage was high, nominally sized 200mm x 50mm boards shrunk to 45-48mm x 180-190mm.
See photographs of the thermally modified timber in this study here »
DMDHEU modification
| Board | Sample # | Nitrogen % - Heartwood | Nitrogen % - Sapwood |
|---|---|---|---|
| P1 | 1 | 5.8 | 3.9 |
| P1 | 2 | 4.9 | 3.9 |
| P1 | 3 | 5.1 | 3.9 |
| P2 | 1 | 5.8 | - |
| P2 | 2 | 5.6 | - |
| P2 | 3 | 5.5 | - |
| P3 | 1 | - | 4.4 |
| P4 | 1 | - | 3.6 |
| P5 | 1 | - | 3.9 |
Test results are available in the Scion report.
Appearance products
The sawn poplar timber from this study was used to create a range of appearance products.
Poplar table
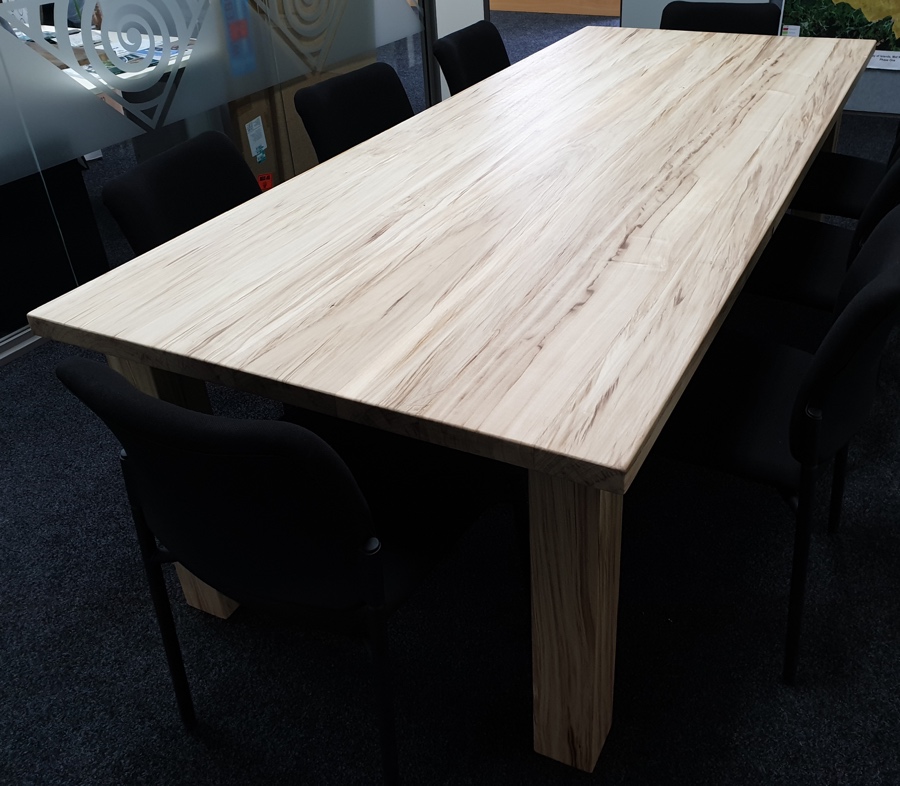
Kawa poplar table produced from research timber.
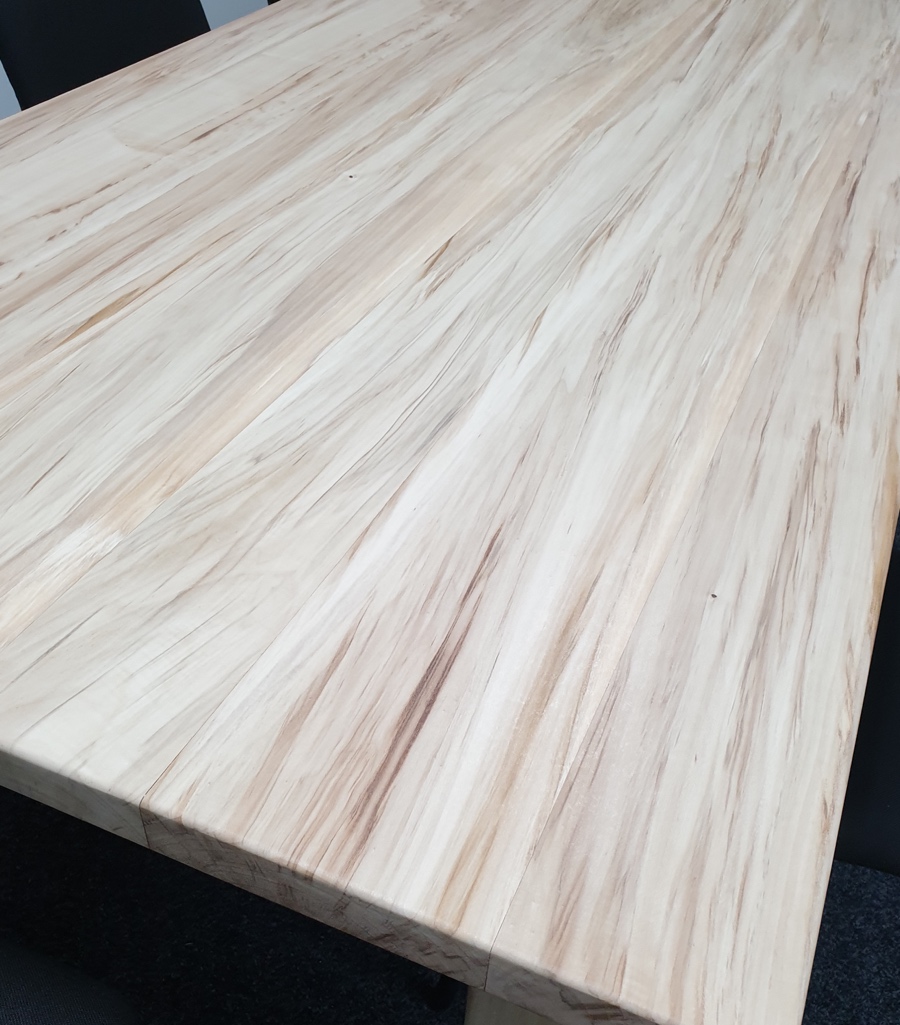
Kawa poplar table showing attractive timber patterning.
Poplar door
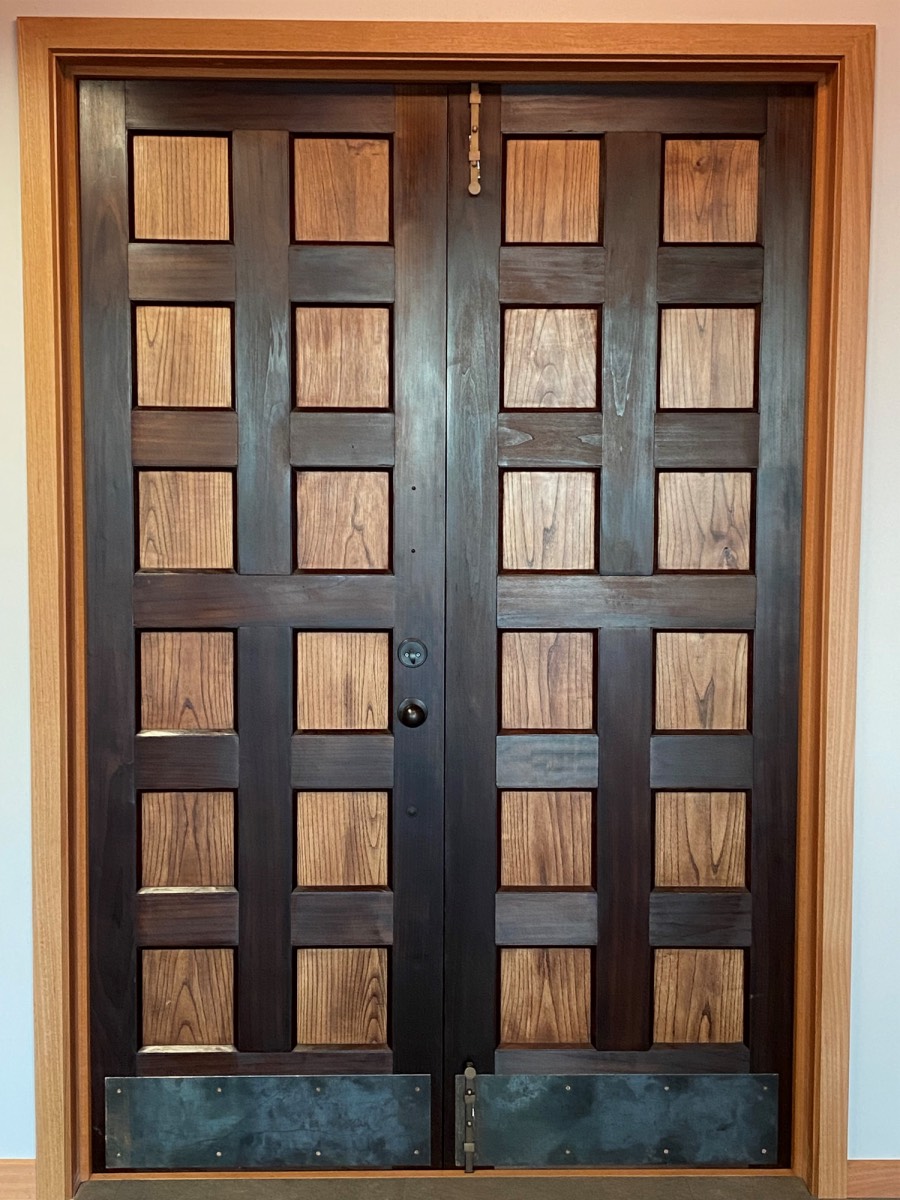
Exterior door made with thermally modified Kawa poplar (inlay panels are elm).
Poplar test cabin
The poplar test cabin was transported to the NRC Mata nursery site in August 2022.
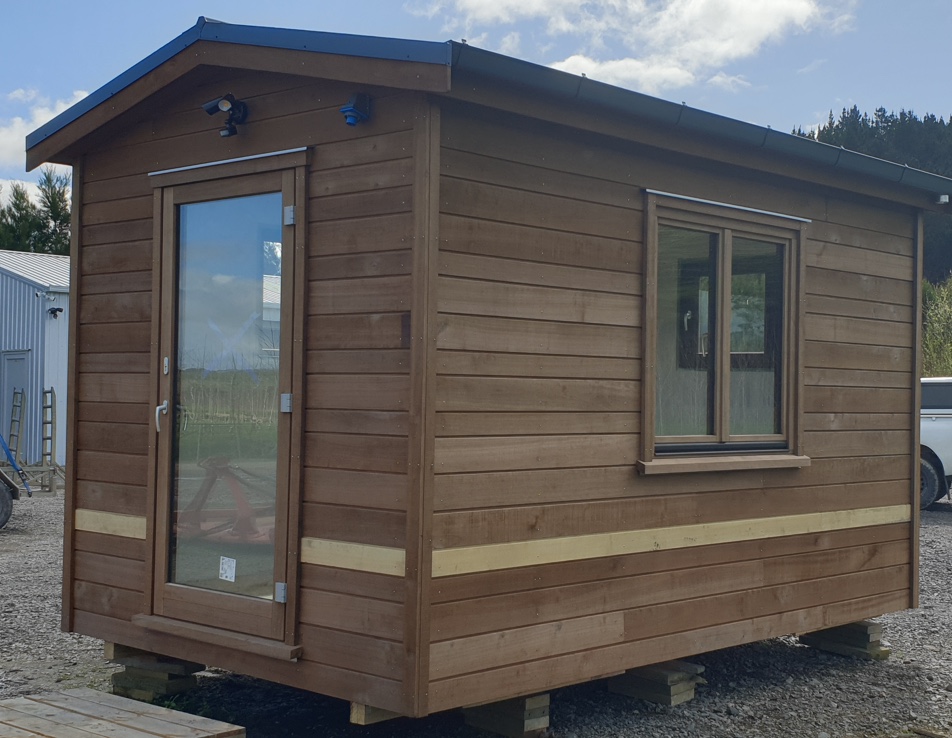
Thermally modified uncoated Kawa poplar weatherboards, corner boxes, fascia, window/door joinery and window surrounds. The light-coloured weatherboards in the fifth row from the bottom is H3.2 micronised copper azoles (MCA) treated Kawa poplar control.
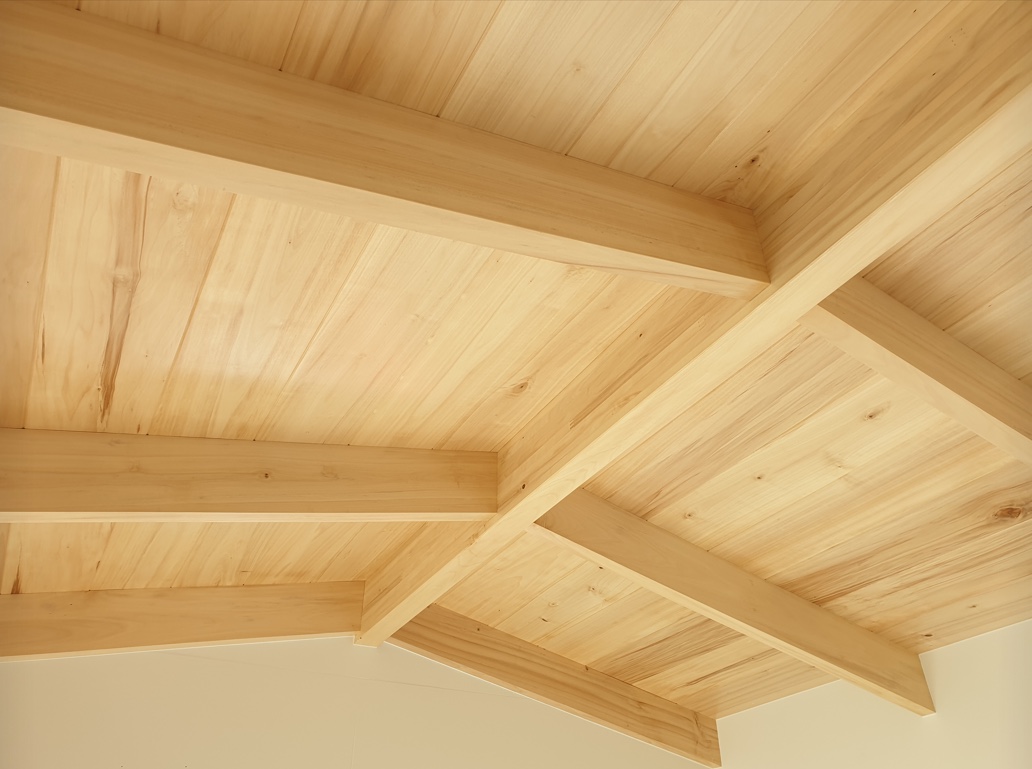
Kawa poplar glulam beam and solid timber rafters, with 200mm TG&V sarking
See photographs of the poplar test cabin being constructed here »
Poplar floor
The coating with non-yellowing epoxy followed by water-based polyurethane was very successful, both in terms of application and appearance. The floor appeared to be significantly harder than if only coated with polyurethane, but hardness was not tested.
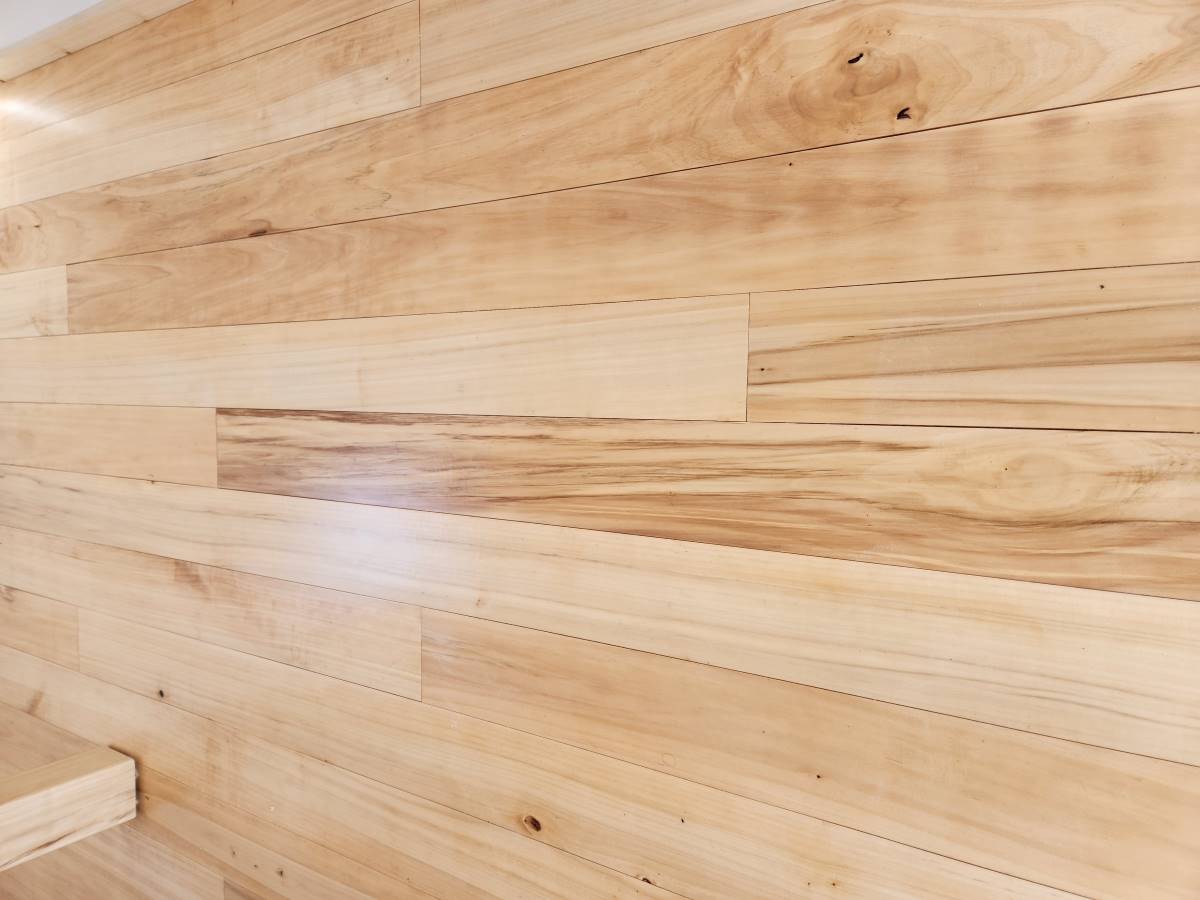
Poplar floor in the test cabin. The surface of this floor was successfully hardened using epoxy. Moisture level was too high at the time of laying and the floor "opened up" with slight gaps between the boards. This should be easily remedied.
Structural poplar
Framing and joists nailed well and were much like radiata pine to handle. Some boards had bow or crook which the builder rejected, then used for nogs and short lengths. Joists were stiff and rafters were attractive, complementing the poplar sarking. The laminated clearwood beam became a feature and joins between laminates were barely noticeable because of the indistinct latewood.
Poplar sarking
The sarking remained stable in service and didn't shrink noticeably. The water-based satin polyurethane didn't yellow the attractive pale colour and timber grain, but also didn't bring out much lustre in the grain.
Poplar weatherboards
During the first summer the micronized copper azoles (MCA) H3.2 treated weatherboards experienced some cupping, whereas the thermally modified weatherboards remained very stable and without any noticeable cupping or movement in service. Because the cladding was not coated, during the first summer the surface began to silver. The thermally modified cladding silvered faster than the MCA treated cladding into the classical silver colour seen in cedar weatherboards.
Thermally modified poplar window and door joinery
The thermally modified window and door joinery began silvering at the same rate as the thermally modified cladding. No movement was observed during the first summer.
Preservative treatment
A range of timber preservative treatment tests were undertaken. These included chrome copper arsenic (CCA) H4 treated posts, CCA H3.2 treated sawn timber, and MCA H3.2 treated weatherboards.
CCA H4 treated Kawa posts
Four quarter round posts, four round posts and two round strainers were tested for retention and penetration as per NZS 3640:2003.
| Sample name | Description | Sapwood % | Penetration spot test | Arsenic %m/m |
Chromium %m/m |
Copper %m/m |
Total Active Elements (TAE) %m/m (Critical level 0.72) |
Retention Analysis Outcome |
|---|---|---|---|---|---|---|---|---|
| 1 | Round post, radiata control | 90 | Pass | 0.479 | 0.548 | 0.297 | 1.32 | Pass |
| 2 | Round post, radiata control | 90 | Pass | 0.461 | 0.526 | 0.282 | 1.27 | Pass |
| 3 | Round post, Kawa | 90 | Fail | 0.226 | 0.227 | 0.126 | 0.58 | Fail |
| 4 | Round post, Kawa | 90 | Fail | 0.215 | 0.211 | 0.116 | 0.54 | Fail |
| 5 | Round strainer, Kawa | 85 | Fail | 0.313 | 0.319 | 0.178 | 0.81 | Pass |
| 6 | Round strainer, Kawa | 75 | Fail | 0.258 | 0.265 | 0.149 | 0.67 | Fail |
| 7 | Quarter round post, Kawa | 90 | Pass | 0.224 | 0.231 | 0.126 | 0.58 | Fail |
| 8 | Quarter round post, Kawa | 90 | Fail | 0.258 | 0.264 | 0.151 | 0.71 | Fail |
| 9 | Quarter round post, Kawa | 100 | Pass | 0.270 | 0.279 | 0.159 | 0.71 | Fail |
| 10 | Quarter round post, Kawa | 90 | Fail | 0.258 | 0.263 | 0.141 | 0.66 | Fail |
Test outcome: Samples 1 and 2 (radiata controls) met the requirements of the specifications for H4 CCA treated roundwood as per NZS 3640:2003. Samples 3-10 (Kawa poplar) did not meet the requirements of the specifications for H4 CCA treated roundwood as per NZS 3640:2003.
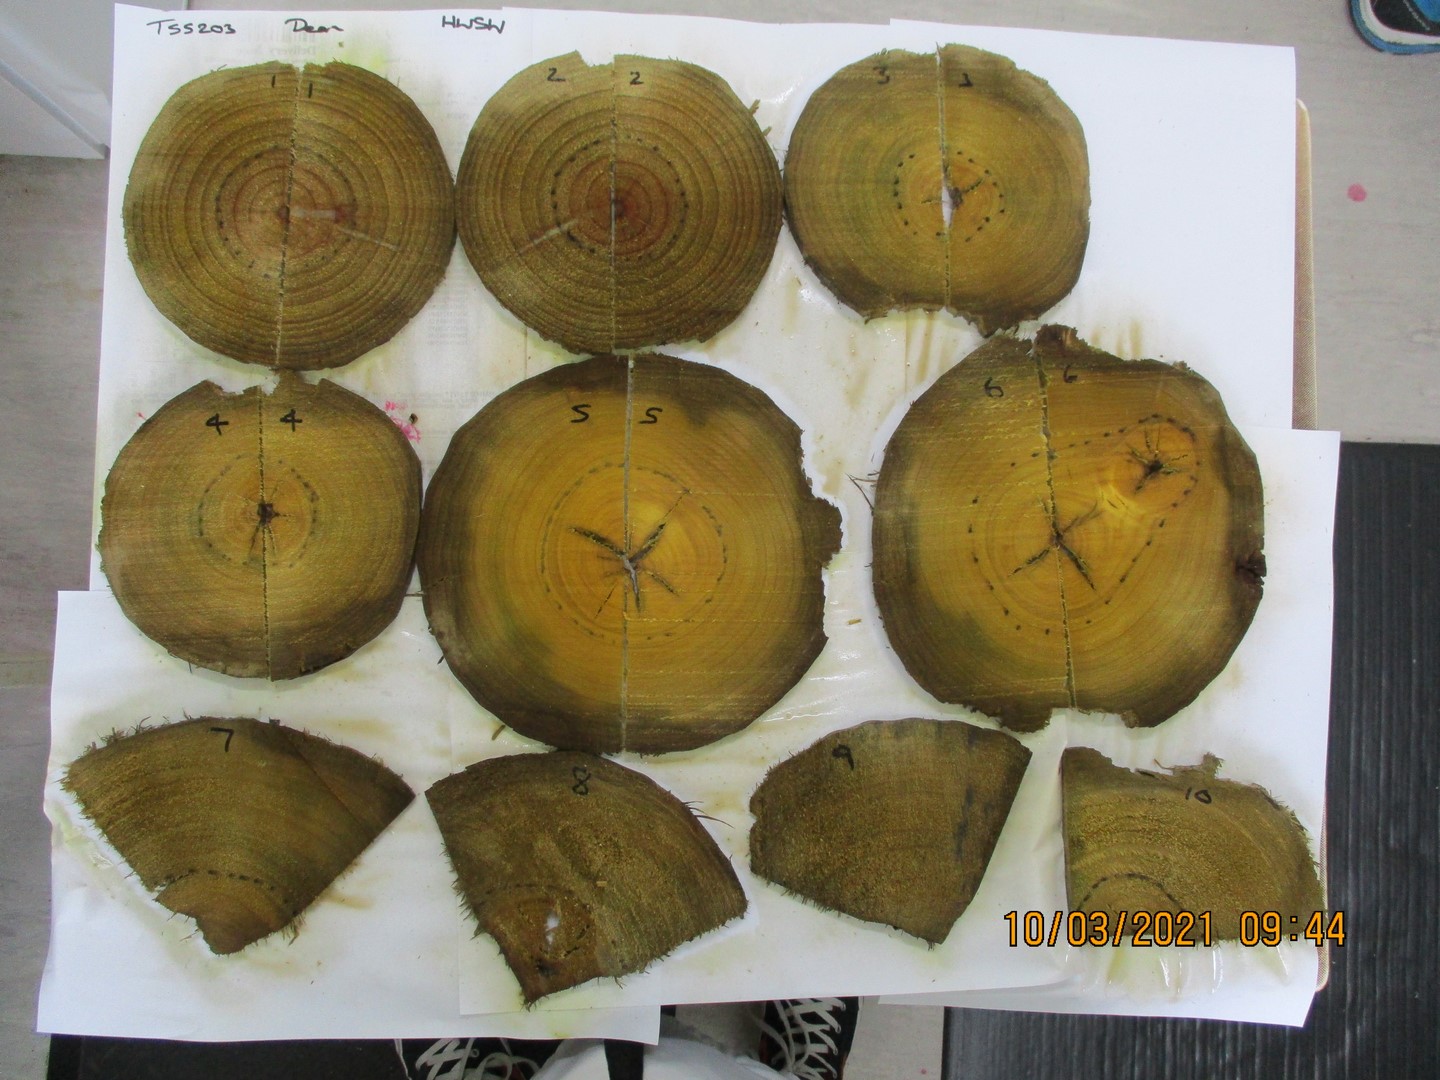
Figure 6: The VBRT test with ammonia buffer (heartwood/sapwood colour test) shows heartwood as red in the radiata samples (1 and 2) but did not determine the poplar heartwood boundary, which was guessed based on general colour of the samples.
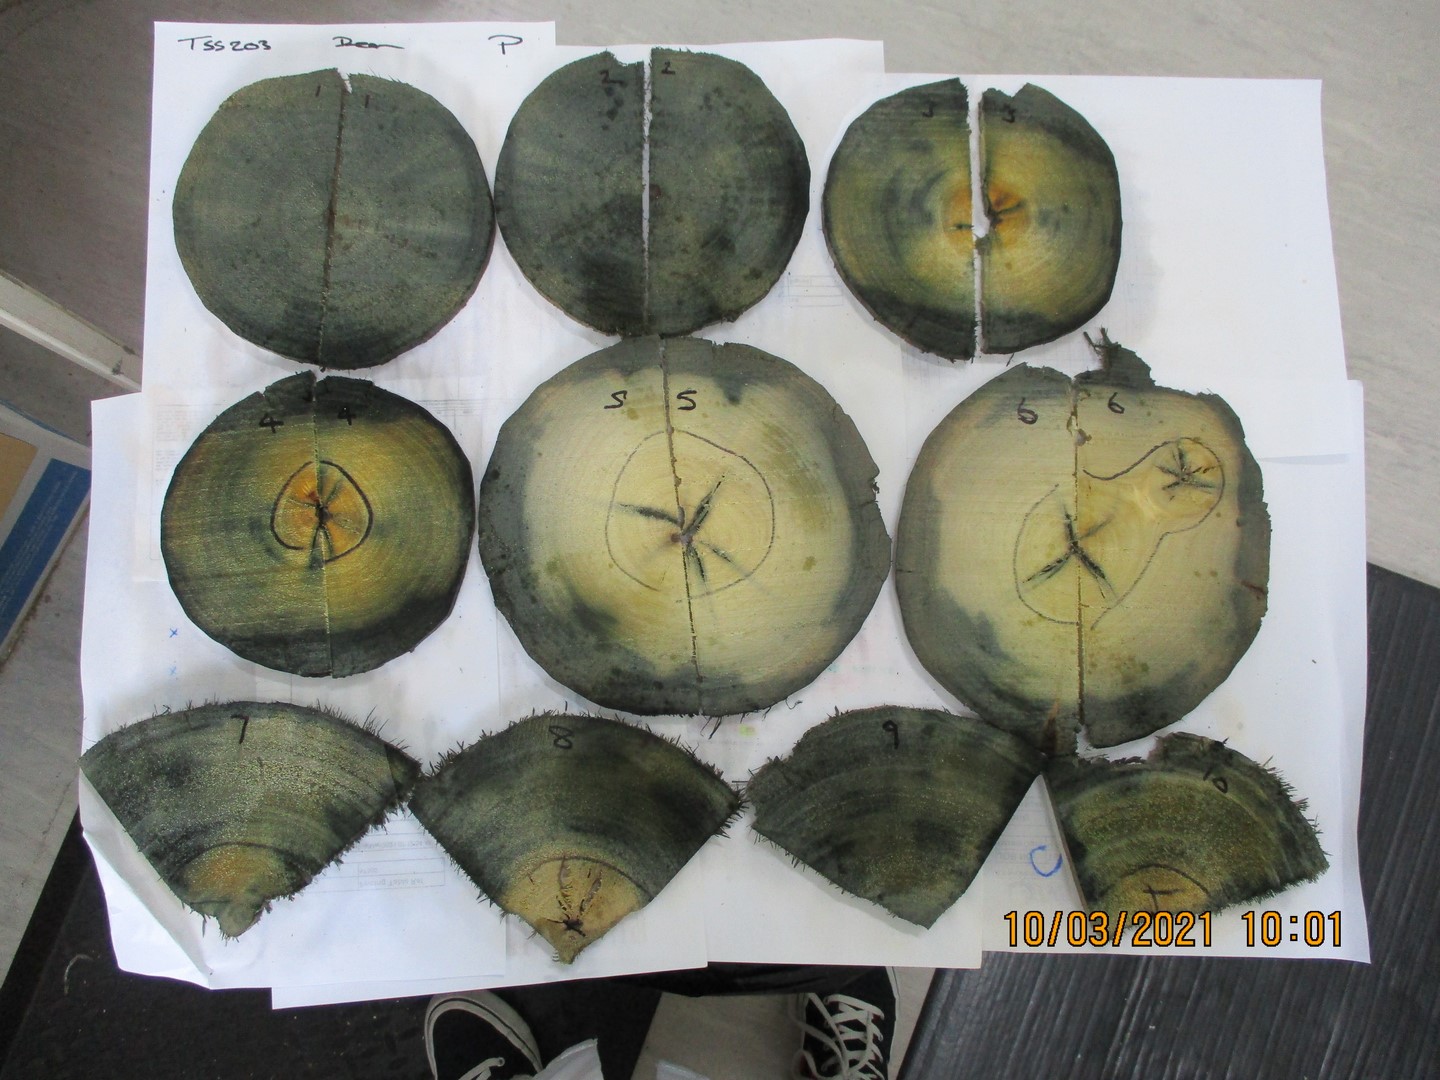
Figure 7: The penetration test shows the presence of preservative, which is only required in sapwood.
H4 CCA treated square poplar posts
Samples of sawn poplar posts (air dried prior to treatment) supplied by Ian Wilson all passed the required CCA retention as per NZS 3640:2003 based on full cross section analysis (Table 15).
| Sample | Retention Analysis Arsenic %m/m | Retention Analysis Chromium %m/m | Retention Analysis Copper %m/m | Retention Analysis TAE %m/m (Critical Level 0.72) |
Retention Analysis Outcome |
|---|---|---|---|---|---|
| 1 | 0.265 | 0.308 | 0.174 | 0.75 | Pass |
| 2 | 0.587 | 0.635 | 0.383 | 1.61 | Pass |
| 3 | 0.399 | 0.402 | 0.266 | 1.07 | Pass |
| 4 | 0.593 | 0.626 | 0.367 | 1.59 | Pass |
| 5 | 0.297 | 0.332 | 0.215 | 0.84 | Pass |
| 6 | 0.329 | 0.356 | 0.225 | 0.91 | Pass |
| 7 | 0.601 | 0.637 | 0.382 | 1.62 | Pass |
| 8 | 0.272 | 0.319 | 0.177 | 0.77 | Pass |
| 9 | 0.275 | 0.301 | 0.184 | 0.76 | Pass |
| 10 | 0.406 | 0.406 | 0.230 | 1.04 | Pass |
| 11 | 0.335 | 0.362 | 0.200 | 0.90 | Pass |
| 12 | 0.308 | 0.350 | 0.206 | 0.86 | Pass |
| 13 | 0.602 | 0.602 | 0.371 | 1.57 | Pass |
| 14 | 0.303 | 0.315 | 0.179 | 0.80 | Pass |
| 15 | 0.311 | 0.324 | 0.196 | 0.83 | Pass |
No analysis of penetration was provided but it is assumed all samples passed this test based on the photo provided by IVS labs:
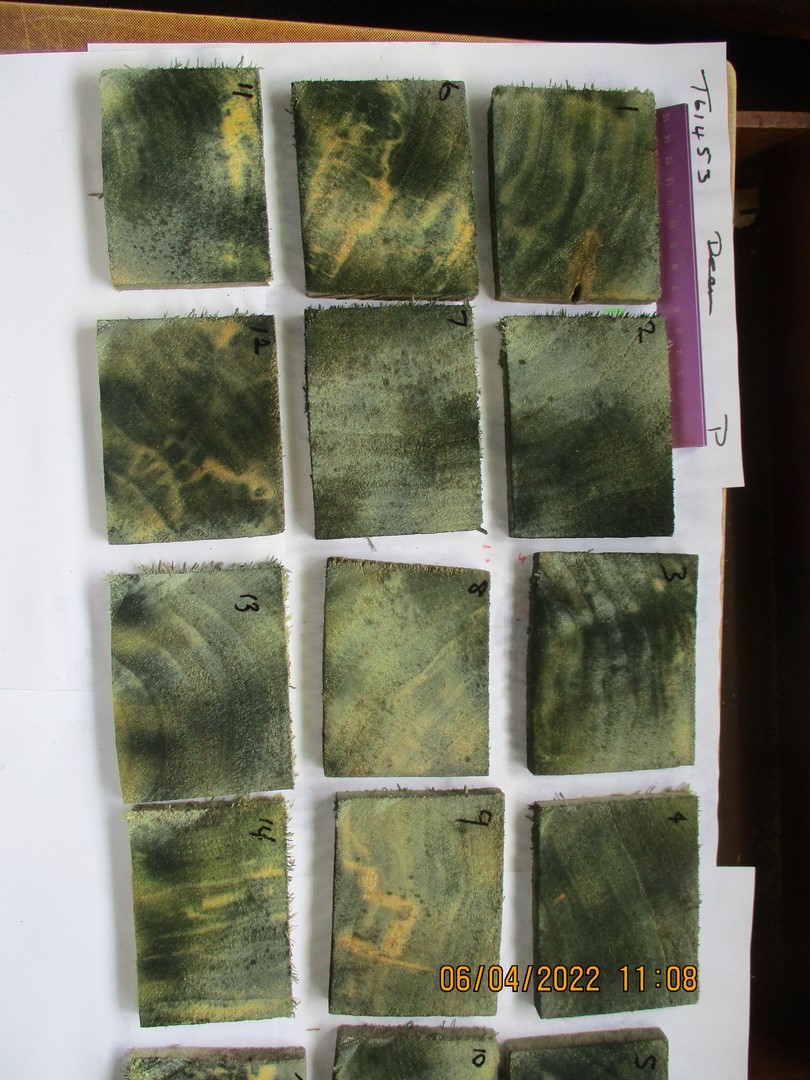
Figure 8: Evident from this photograph is that some of these posts (e.g., sample 13) contained heartwood, which was penetrated by the preservative.
H3.2 preservative treated sawn poplar
H3.2 CCA preservative treated 30mm poplar
Identifying poplar sapwood using the VBRT colour test method was largely unsuccessful. However, an attempt was made to mark the heartwood/sapwood boundary (Figure 9).
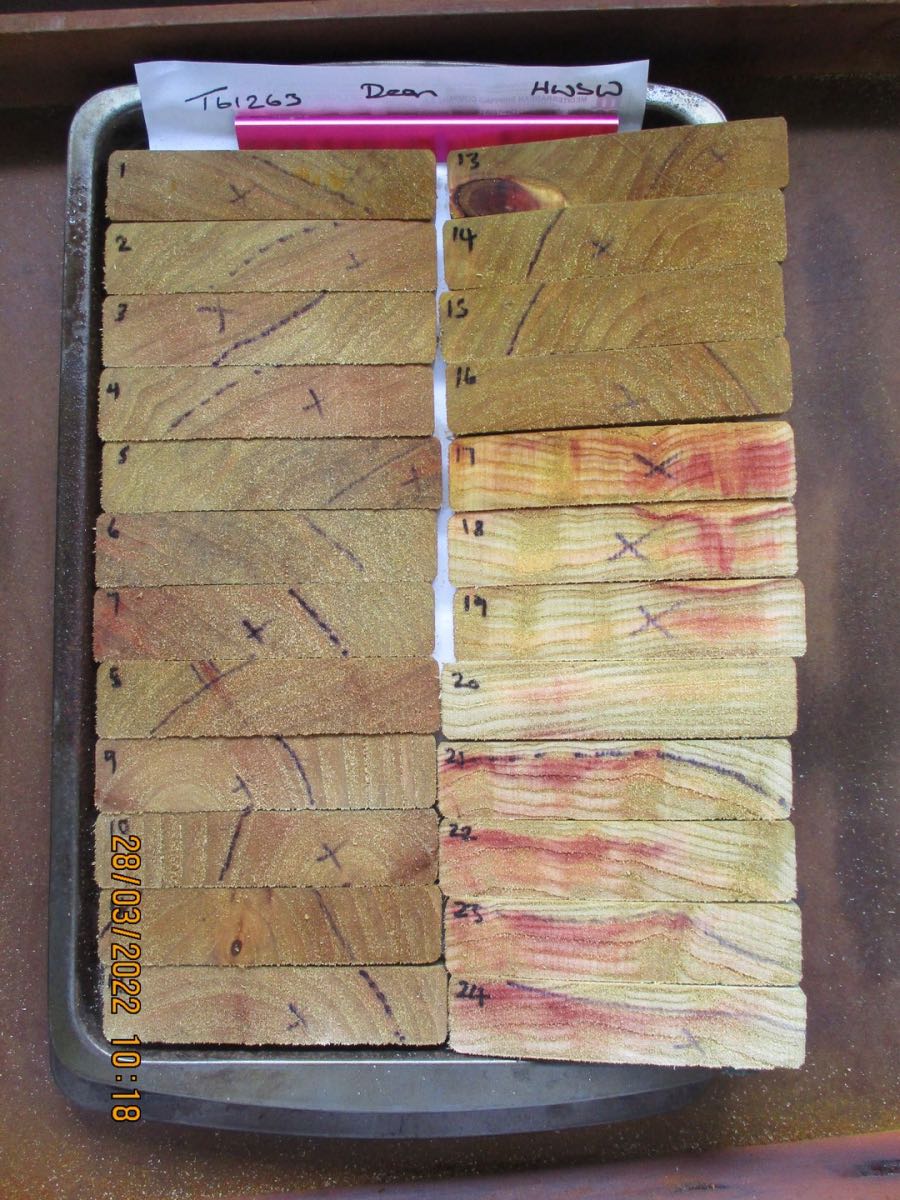
Figure 9: Assumed heartwood (marked "x") and sapwood.
Sapwood percentage was then estimated. Where no sapwood was present the Penetration spot test was automatically passed. Where sapwood was present, only this was assessed for evidence of penetration based on the colour of the penetration test (Figure 10).
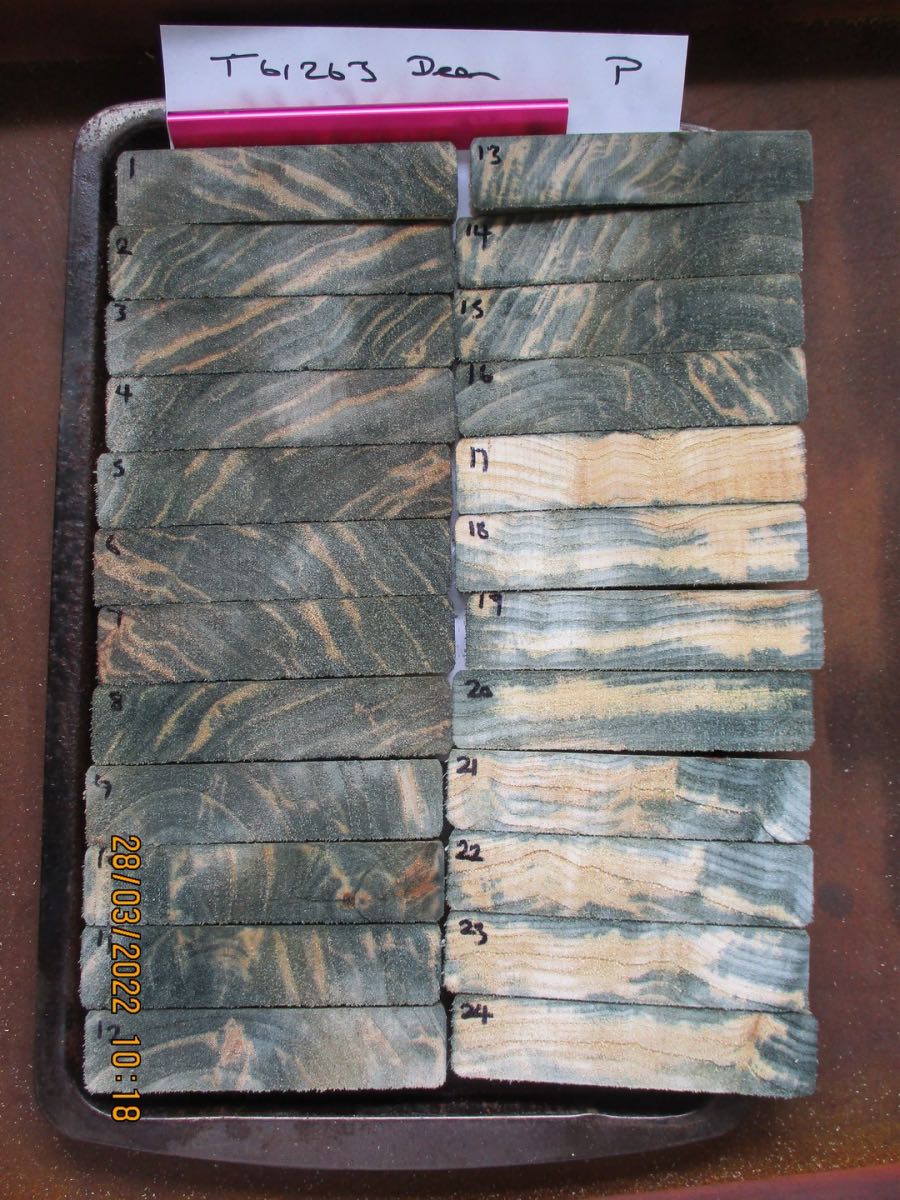
Figure 10: Penetration test
Where sapwood was present, only this was then also analysed for retention (Table 16).
| Sample | Test number | Sapwood % | Penetration spot test |
Retention analysis Arsenic %m/m |
Retention analysis Chromium %m/m |
Retention analysis Copper %m/m |
Retention analysis TAE %m/m (Critical level 0.37) |
Retention analysis Outcome |
|---|---|---|---|---|---|---|---|---|
| 1a | 1 | 40 | Pass | 0.211 | 0.233 | 0.117 | 0.56 | Pass |
| 1b | 2 | 50 | Pass | 0.223 | 0.229 | 0.125 | 0.58 | Pass |
| 1c | 3 | 50 | Pass | 0.222 | 0.230 | 0.122 | 0.57 | Pass |
| 1d | 4 | 30 | Pass | 0.215 | 0.252 | 0.116 | 0.58 | Pass |
| 1e | 5 | 80 | Pass | 0.256 | 0.285 | 0.136 | 0.68 | Pass |
| 1f | 6 | 25 | Pass | 0.247 | 0.258 | 0.140 | 0.64 | Pass |
| 1g | 7 | 30 | Pass | 0.222 | 0.227 | 0.129 | 0.58 | Pass |
| 1h | 8 | 25 | Pass | 0.218 | 0.254 | 0.115 | 0.59 | Pass |
| 2a | 9 | 40 | Pass | 0.238 | 0.255 | 0.134 | 0.63 | Pass |
| 2b | 10 | 40 | Pass | 0.230 | 0.235 | 0.131 | 0.60 | Pass |
| 2c | 11 | 40 | Pass | 0.258 | 0.274 | 0.150 | 0.68 | Pass |
| 2d | 12 | 20 | Pass | 0.202 | 0.223 | 0.111 | 0.54 | Pass |
| 2e | 13 | 45 | Pass | 0.179 | 0.202 | 0.091 | 0.47 | Pass |
| 2f | 14 | 30 | Pass | 0.183 | 0.191 | 0.102 | 0.48 | Pass |
| 2g | 15 | 20 | Pass | 0.182 | 0.184 | 0.101 | 0.47 | Pass |
| 2h | 16 | 15 | Pass | 0.187 | 0.194 | 0.104 | 0.48 | Pass |
| 3a | 17 | 0 | Pass | N/A | N/A | N/A | N/A | Pass |
| 3b | 18 | 0 | Pass | N/A | N/A | N/A | N/A | Pass |
| 3c | 19 | 0 | Pass | N/A | N/A | N/A | N/A | Pass |
| 3d | 20 | 100 | Fail | 0.130 | 0.141 | 0.068 | 0.34 | Fail |
| 3e | 21 | 25 | Fail | 0.214 | 0.229 | 0.129 | 0.57 | Pass |
| 3f | 22 | 40 | Fail | 0.187 | 0.194 | 0.112 | 0.49 | Pass |
| 3g | 23 | 25 | Fail | 0.151 | 0.160 | 0.085 | 0.40 | Pass |
| 3h | 24 | 25 | Fail | 0.135 | 0.147 | 0.071 | 0.35 | Fail |
Because the VBRT colour test was unable to accurately determine the heartwood sapwood boundary, retention analysis was repeated, assuming the full cross section of every sample was 100% sapwood (Table 17).
| Sample | Test number | Retention analysis Arsenic %m/m |
Retention analysis Chromium %m/m |
Retention analysis Copper %m/m |
Retention analysis TAE %m/m (Critical level 0.37) |
Retention analysis Outcome |
|---|---|---|---|---|---|---|
| 1a | 1 | 0.193 | 0.219 | 0.105 | 0.52 | Pass |
| 1b | 2 | 0.206 | 0.217 | 0.114 | 0.54 | Pass |
| 1c | 3 | 0.202 | 0.215 | 0.111 | 0.53 | Pass |
| 1d | 4 | 0.202 | 0.229 | 0.109 | 0.54 | Pass |
| 1e | 5 | 0.216 | 0.247 | 0.117 | 0.58 | Pass |
| 1f | 6 | 0.231 | 0.239 | 0.132 | 0.60 | Pass |
| 1g | 7 | 0.205 | 0.212 | 0.113 | 0.53 | Pass |
| 1h | 8 | 0.197 | 0.224 | 0.107 | 0.53 | Pass |
| 2a | 9 | 0.254 | 0.273 | 0.150 | 0.68 | Pass |
| 2b | 10 | 0.239 | 0.245 | 0.138 | 0.62 | Pass |
| 2c | 11 | 0.294 | 0.289 | 0.176 | 0.76 | Pass |
| 2d | 12 | 0.270 | 0.291 | 0.162 | 0.72 | Pass |
| 2e | 13 | 0.215 | 0.234 | 0.123 | 0.57 | Pass |
| 2f | 14 | 0.238 | 0.253 | 0.136 | 0.63 | Pass |
| 2g | 15 | 0.255 | 0.260 | 0.145 | 0.66 | Pass |
| 2h | 16 | 0.264 | 0.263 | 0.153 | 0.68 | Pass |
| 3a | 17 | 0.023 | 0.028 | 0.010 | 0.06 | Fail |
| 3b | 18 | 0.090 | 0.096 | 0.045 | 0.23 | Fail |
| 3c | 19 | 0.116 | 0.122 | 0.064 | 0.30 | Fail |
| 3d | 20 | 0.127 | 0.143 | 0.070 | 0.34 | Fail |
| 3e | 21 | 0.135 | 0.142 | 0.080 | 0.36 | Fail |
| 3f | 22 | 0.121 | 0.127 | 0.072 | 0.32 | Fail |
| 3g | 23 | 0.088 | 0.094 | 0.050 | 0.23 | Fail |
| 3h | 24 | 0.085 | 0.092 | 0.047 | 0.22 | Fail |
H3.2 CCA preservative treated 20mm Kawa poplar decking
Samples 10 and 11 were two samples from the one radiata control board from the same batch. Samples 10 and 11 passed the penetration test but the poplar samples failed because of patchy penetration of the preservative (Figure 11).
.JPG)
Figure 11: Penetration test.
| Sample | Penetration spot test | Retention analysis Arsenic %m/m | Retention analysis Arsenic %m/m | Retention analysis Chromium %m/m | Retention analysis Copper %m/m | Retention Analysis Outcome |
|---|---|---|---|---|---|---|
| 1 | Fail | 0.185 | 0.168 | 0.081 | 0.43 | Pass |
| 2 | Fail | 0.195 | 0.177 | 0.086 | 0.46 | Pass |
| 3 | Fail | 0.271 | 0.244 | 0.133 | 0.65 | Pass |
| 4 | Fail | 0.160 | 0.142 | 0.072 | 0.37 | Pass |
| 5 | Fail | 0.221 | 0.202 | 0.099 | 0.52 | Pass |
| 6 | Pass | 0.236 | 0.221 | 0.104 | 0.56 | Pass |
| 7 | Fail | 0.236 | 0.215 | 0.105 | 0.56 | Pass |
| 8 | Fail | 0.195 | 0.178 | 0.084 | 0.46 | Pass |
| 9 | Fail | 0.203 | 0.189 | 0.091 | 0.48 | Pass |
| 10 | Fail | 0.175 | 0.165 | 0.075 | 0.42 | Pass |
| 11 | Pass | 0.147 | 0.161 | 0.092 | 0.40 | Pass |
| 12 | Pass | 0.162 | 0.177 | 0.103 | 0.44 | Pass |
Micronised Copper Azole (MCA) H3.2 treated weatherboards
Samples 1 and 2 were two samples from the one radiata control board from the same batch. Samples 1 and 2 passed the penetration test but the poplar samples failed because of patchy penetration of the preservative (Figure 12).
.JPG)
Figure 12: Penetration test.
| Sample | Sapwood % | Penetration Spot Test | Retention Analysis Copper %m/m |
|---|---|---|---|
| 1 | Pass | 0.150 | |
| 2 | Pass | 0.157 | |
| 3 | Pass | 0.069 | |
| 4 | Fail | 0.084 | |
| 5 | Fail | 0.156 | |
| 6 | Fail | 0.210 | |
| 7 | Fail | 0.164 | |
| 8 | Fail | 0.177 | |
| 9 | Fail | 0.179 | |
| 10 | Fail | 0.083 | |
| 11 | Fail | 0.117 | |
| 12 | Fail | 0.202 | |
| 13 | Pass | 0.220 |
Full cross section retention of copper preservative was similar to the radiata control for most Kawa poplar samples, but were quite variable, ranging from 0.069 % to 0.220% m/m.
Disclaimer: The opinions and information provided in this report have been provided in good faith and on the basis that every endeavour has been made to be accurate and not misleading and to exercise reasonable care, skill and judgement in providing such opinions and information. The Author and NZFFA will not be responsible if information is inaccurate or not up to date, nor will we be responsible if you use or rely on the information in any way.