Improving siting recommendations for farm forestry eucalypts using GIS maps
By Angus Gordon, Report: Improving siting recommendations for farm forestry eucalypts using GIS maps, October 2013.
This project set out to collect growth and performance data on 16 Eucalyptus species that had been planted in trial sites across New Zealand under a previous SFF funded project (L03-007). All of the previous trial sites had to be visited so that the relevant site descriptors could be recorded, as well as the growth and performance data of all the surviving trees. This site visit and data collection regime was critical to achieve before the growth of any individual species at any trial site, began to impact on the trees in a neighbouring species row, and before dominant trees could suppress their sub dominant neighbours.
Project Objectives
Once all the trial site data had been collected, data analysis had to occur for each species at each site and an overall methodology for data presentation had to be chosen. In the case of this trial, mean annual height growth increment (MAI) in metres per year was chosen as the most accurate descriptor of tree and species performance. Other methods of performance measure could have been taken such as diameter at breast height (DBH) or stem volume, but these other measures are best used to describe intra species performance variations as opposed to inter species performance variation as there is quite significant variation in stem form between the species that were trialled. All the species and site data was to be permanently recorded in an archive and the outputs posted on a MS excel spread sheet so that further analysis could be undertaken if required in the future. Utilising this data to integrate individual species performance using a GIS based mapping system to infer the potential performance of any of the chosen species and portray the outputs visually was the ultimate goal of this project. This would essentially enable the project team and other users to “join the dots” of individual plot data sets as part of a nationwide species performance selection tool and reduce the dependence that many eucalypt planters have on small snippets of anecdotal information in any one region or locality.
The final goal was to publish this information in publicly available forum for use by the forestry industry at large.
Maps
Siting maps for the following species are available as jpg images:
Approach
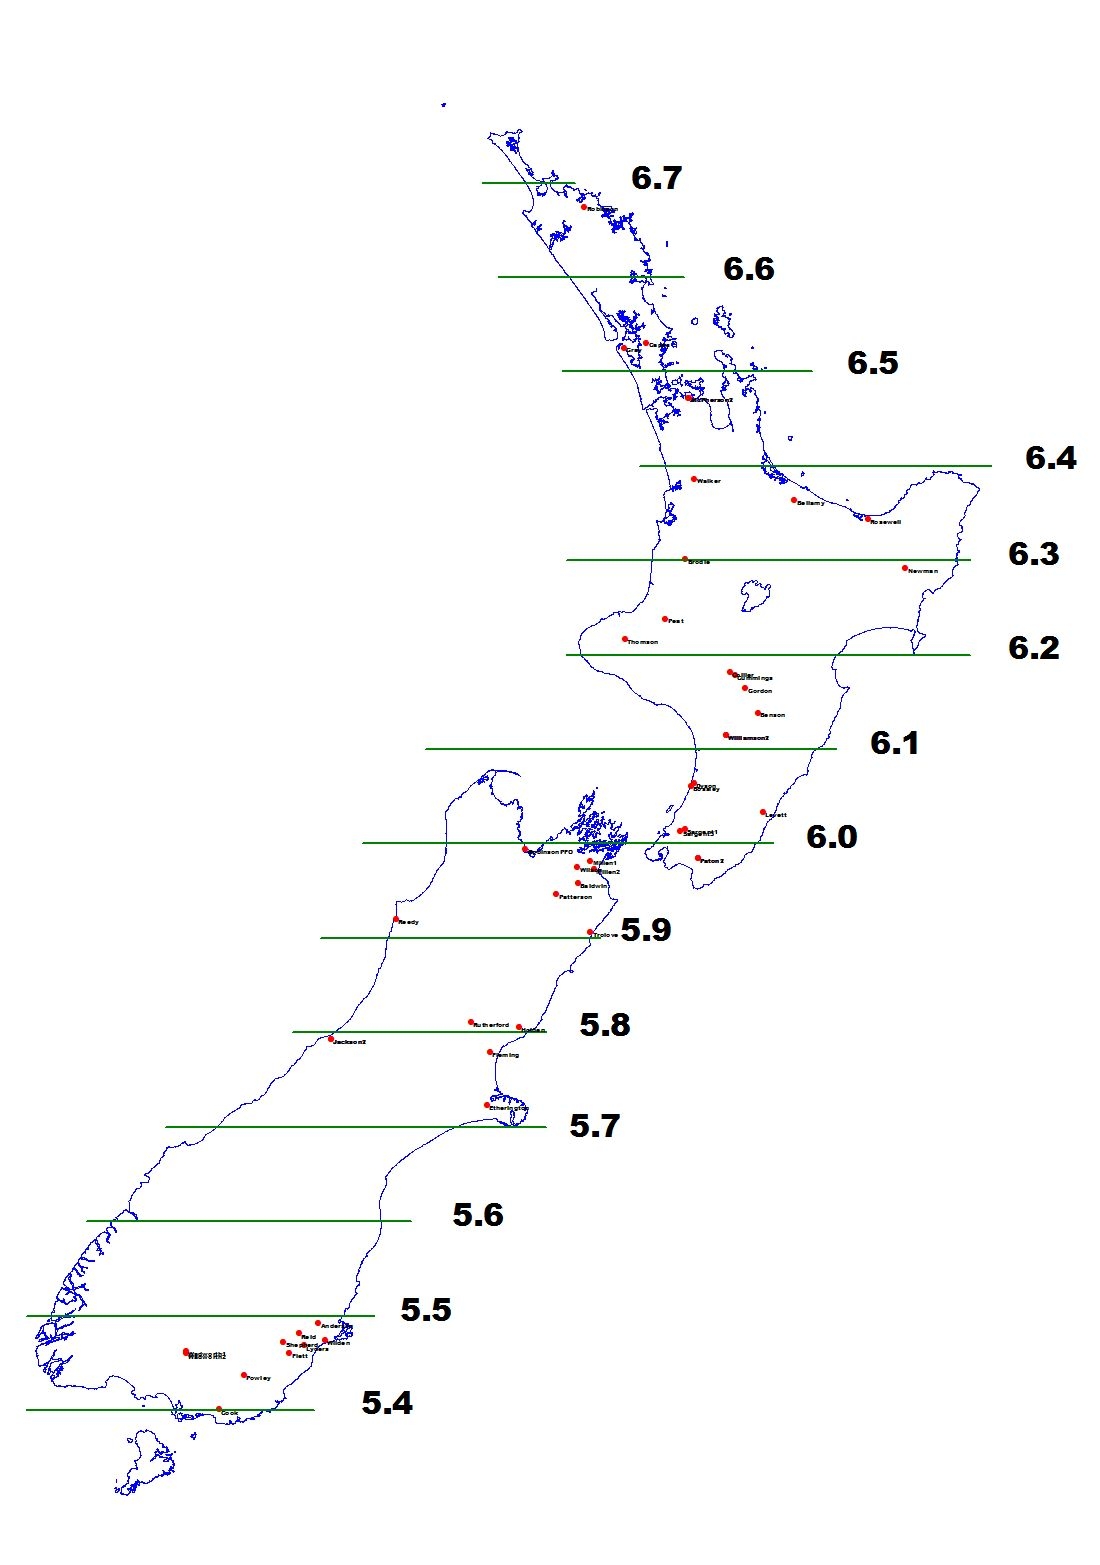
This project involved data collection, interpretation, and the production where possible of GIS based performance maps for any of the measured eucalypt species at the trial sites. The project relied on three key members of the team to undertake much of the workload with the rest of the team as advisory members. The two members of the project team that undertook data collection and interpretation were Angus Gordon and Ian Nicholas. Angus had project managed the previous SFFL03-007 Eucalypt species survival project, and so had a fairly intimate knowledge of the previous trials and the owners of the sites. As a member of the NZFFA eucalypt action group he also had developed an experienced eye at identification of the trial species that were measured in this project. Ian was a forest scientist who had spent many years measuring and interpreting trial plots and preparing the data for analysis and had a passion for eucalypts and had developed an intuitive feel for the performance of some of the trialled species. He had also been involved in many projects where eucalypt silviculture and growth had been the focus over his research career. Ian and Angus worked collectively as the data collection team and provided continuity from site to site over the 50 sites sampled. At some sites members of the broader farm forestry community helped with the measurement process, performing tasks such as line cutting or providing transport. This was especially important in areas that had thick gorse and other shrub weeds present.
Ian performed the initial data analysis and produced mean annual increment (MAI) growth performance figures for each species at each site. This data was then passed onto the third member of the project team, Roger May, for further analysis and collation.
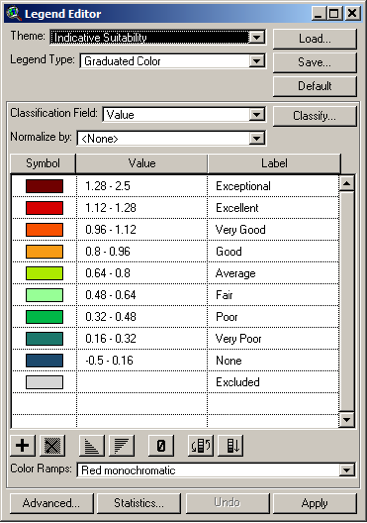
Roger May is a GIS mapping specialist who works primarily for the forest industry. His skill set enabled him to collate all the data that had been provided, plot it and perform statistical analysis on the plotted outputs. All of the site factors that were measured were plotted against MAI to produce scatter plots. The site factors that were measured and plotted were as follows. Latitude, altitude, annual rainfall, consecutive frost free days, February maximum temperature, July minimum temperature, Land use class, soil PH, soil type, potential rooting depth, slope class, and exposure (Topex). Where possible mathematical regression techniques were used to produce best fit curves for the plotted outputs over the species data sets so that any nationwide trends for any species could be observed. Some site factors produced very poor correlations when plotted against MAI and were excluded form further analysis, where as others had quite strong relationships. Those site factors that were chosen for further use in producing the GIS mapping tools were latitude, consecutive frost free days, February maximum temperature and July minimum temperature. A set of correlation coefficients were produced for our chosen species from the fitted curves of the data plots, and these coefficients were then used to layer mathematically the resulting predicted growth response of our chosen species to the four site factors, enabling us to produce the GIS mapping outputs. It is the differences in sensitivity to our four site factors that each species displays from the site data, that drive the changes in inferred performance on our GIS maps. The number of growth performance steps in the legend, nine in this case were chosen to try to accurately depict the potential performance variations that exist in each species and between species. These visual changes in the maps that are observed by the user are an attempt by the project team to group together areas of the landscape that should produce similar growth performance for any of the mapped species. The output by its very scale is coarse, and so actual field performance by any species will have a further layer of variability that cannot be accurately depicted on these mapped outputs.
When the analysis for all individual species was observed, some species did have better correlations to changes in site factors than others. One important thing to note was that not all of the 16 species that were placed in the original trial were planted at an equal number of sites. This did limit the number of species that had robust enough data sets to perform statistical analysis on, and accurately plot. Six stringybark eucalypt species were chosen for mapping. They were E. globoidea, E. laevopinea, E. macrorhyncha, E. muelleriana, E. pilularis and E. youmanii. A seventh species, E. fastigata which is a member of the ash group of eucalypts, was used as our control species and had a plot produced for comparison purposes. Other species that were only of regional interest, or had been included in the original survival trials as a further control but were not stringybark eucalypts were deliberately not chosen for mapping. E. microcorys and E. globulus ssp maideni were not plotted for these reasons.
Main findings from this project
The main emphasis of this project was on data collection, analysis and the production of 6 GIS based maps for the chosen stringybark species and a comparison map for our control species.
These maps are the first attempt in New Zealand to produce an indicative productivity mapping tool for the chosen stringybark eucalypts on a nationwide basis. Importantly it is based on a large number of trial sites which is rare for these species as they have not been widely adopted by the commercial forestry sector prior to now. The ability to produce the indicative productivity maps was enabled by the formalised and structured approach to original species survival trials that the data was drawn from.
The main findings of this project can thus be broadly described as:
- The ability to predict the generalised performance of the 6 plotted stringybark eucalypts species on sites where survival is not compromised by site factors that were not measured by this trial. Out of season frosting is one such site factor that is very difficult to accurately predict. Currently there is no nationally available dataset for predicting the probability of out of season frosting, but it is one of the key factors that influence the survival and performance of many eucalypt species at a young age. Many of the data sets from trial sites that have very low or no surviving trees had good species survival performance up until their second year following planting, when a heavy late frost (-5 deg C in December2006) destroyed most or all the trees on those sites.
- This project has pushed out the boundaries of where it could previously have been considered prudent to establish any of these species on a nationwide basis. Many of what were previously thought to be very tender species are surviving as far south as Southland where appropriate siting was undertaken. Having said that, there are 2 important measures of the relative success or failure of any trial species. The first is survival percentage of the planted seedlings and the second is the subsequent growth performance. It is important to note that some of our mapped species had far superior survival performance nationwide, but have lower annual height growth increments and so when observing the GIS maps it would appear at first glance, and based on the relative colouration of the maps, that some species are less favourable to plant. This good survival, but slower initial growth is an attribute that is buried deep within the genome of some of the eucalypt species that were trialled. Some species are tough, with good survival characteristics but can be slow starters, whereas others are very quick growers but can be far more fragile when it comes to climatic extremes. It is a classical tortoise and hare analogy.
- A summary of the six mapped stringybark species performance follows, but it is only a brief summary. A fuller assessment of all the species that were trialled will be done at a later date and posted on the NZFFA and SFF websites along with this trial report. E. youmanii and E. macrorhyncha seem to have this characteristic of slow but steady growth and high survival over a wide range of sites. E. youmanii survives and performs over the widest range of latitudes of any of the trial species and on many sites to high altitudes. This confirms what has been seen anecdotally in the few small scale plantings that previously had been attempted in New Zealand with this species. E. macrorhyncha also has a wide survival range, although is more limited over the lower half of the south island. It has superior height growth to E. youmanii which was evident on most sites. One characteristic that both these species share is their poor performance in the warm humid north of the North Island. This seems to indicate that they have evolved in dry low humidity environments that lack the combination of heat and moisture in Australia. We would have to recommend that neither of these species be planted north of Auckland or in the warm humid parts of Bay of plenty without careful consideration of the siting of the potential planting.
E. globoidea survives and grows over a slightly more limited range of New Zealand and shares some of the slow starting characteristics of the previous two mentioned species. It is however far more happy in the warmer and higher rainfall areas of the upper North Island and has superior growth performance as you head north. This species did survive in Southland and coastal Otago (3 sites), but realistically has not really performed well until it was planted north from Banks’ peninsular.
E. laevopinea was the species that probably produced the biggest surprises of this project. Previously held assumptions were that this was a warmth and moisture loving species, however our results show that while this is partly true it is far from the whole truth in terms of survival and to a lesser extent growth. E. Laevopinea survived very well in the North Island and had reduced survival in the south, but like E. globoidea did survive on lower altitude South Island sites as far south as Southland. Growth was compromised on many of the lower South Island sites, so in all practical terms like E. globoidea this species is best planted from Banks peninsular north, but its survival performance and its ability to grow well in wet and dry climates does indicate that it is a candidate for further work if provenances that perform well in cold climates can be found. This would have to be the most plastic species in terms of site requirements that we mapped in this project.
The last two of the plotted species were E. pilularis and E. muelleriana . Both of these species seem to prefer warm moist growing conditions and showed that they survive and perform well in relatively benign sites. E muelleriana can perform well in the South Island north of Banks peninsular and on the West Coast but really comes into its own in the North Island, especially on sites where large numbers of consecutive frost free days predominate. It has been, however, the most unpredictable species that we have mapped. Its lack of consistent survival and growth performance at adjacent sites has remained unexplained. Certainly where warmth and moisture are present it is a good performer. E. pilularis is the most warmth loving of the species that we plotted. Whilst it did survive in some South Island sites, notably at a coastal site in Dunedin it really only has performed adequately from Blenheim north. In the North Island it again performed adequately at low altitude coastal sites, but it was not until it was sited from the Bay of Plenty and north that its performance could be described as good. In a sense this is really only a species that has performed well in warm and humid parts of New Zealand such as the upper half of the north island and at a few benign coastal sites further south and so should be considered a regionally important species for the upper north island, and of only limited interest elsewhere.
All of the six mapped stringybark species can be visually compared against the map for E. fastigata which we have plotted using the same analysis techniques. We chose to map E. fastigata, because a productivity map had previously been produced by Scion for this species using different techniques and so a comparison with our outputs was available. Visually there is a difference between the outputs of the Scion technique and our own, but viewers should note that different productivity measures have been used.
The visual summaries of the performance of the mapped species are just that, and in reality there is a lot more knowledge to be gained by reviewing the spread sheet data sets and the maps simultaneously. One very important point to note is that all the original plantings utilised a maximum of three provenances (families) and sometimes only two provenances per species, thus a very small subset of the available gene pool of each individual species and its potential performance characteristics was available for planting. This may well have skewed the performance of any of the planted species away from where it potentially could be. This is an important point to emphasise as this project is not the gold standard of knowledge on any of these species, it is just a snapshot with a limited gene pool over an equally limited timeframe over fifty New Zealand sites. A recent multifamily importation of E. globoidea by another research body, the Dryland Forestry Initiative, has shown that far superior growth rates and survival to anything that was achieved by any species in this project is possible, if you are prepared to cast the genetic net wide enough and spend enough money.
A review of the spreadsheet data and outputs will show the reader the performance of the other species that were trialled and analysed. The primary reason for not attempting to plot all the original species was purely one of lack of data set size of those species. This does not however exclude these species from further work using these techniques, as the data sets for this project were reliant on the tree performance of a previous trial that was set up in 2003. In the initial stages of the 2003 project some potential candidate species failed to perform in the nursery for reasons that could not be explained at the time and so their absence from our mapping outputs is due to factors other than field survival and performance. This is the case with two species in particular, E. baxteri and E. blaxlandii, which were planted at a very limited number of sites and have performed well.
There are other candidate stringybark eucalypt species that may well be worthy of further research, but likewise they were not included in this project due to their lack of inclusion in the previous 2003 project.
Please do take note of one confounding issue in eucalypt silviculture that this project has not sought to describe. That issue is the one of “micro site”. Eucalypts can be very sensitive to any one of a range of site factors, which individually may not limit survival or growth performance except in extreme circumstances, but collectively can be the difference between success and failure. The term “micro site” is a description of all the physical factors that may impact on a tree at a particular site. Examples are position in the landscape, potential soil water drainage, exposure to wind, frost ponding etc. An accurate description of all the site factors that go into describing a micro site is beyond the original aims of this project and will not be attempted here, however if any user of this resource intends to undertake large scale planting then it would be prudent to familiarise themselves with the particular micro site issues that their chosen species may be sensitive to, and whether these micro siting issues exist at the potential planting site. In the data collection and analysis of this project it did become obvious that in some cases micro site factors had come into play in the poor performance at some sites, however in most cases it was only an issue when a species was pushing the performance boundaries of what its particular genetics allowed.
The difference this project has made
This project has provided an information resource for the plotted species that is valid over the majority of the plantable New Zealand landscape. Because all the species involved in this trial were provided to the trial hosts under a uniform set of circumstances, much of the randomness that occurs when individuals conduct their own one-off experiments due to different nursery techniques and seed parentage was removed. This project has been able to leverage the information gained from the earlier SFF (L03-007) project and turn the results from it into a guidance tool for a grower who wishes to plant in an area that previously has no history of eucalypt plantings, or a site that has no history of plantings with the species that were selected for trialling. The inclusion of E. fastigata as a benchmark species was important, as this species is fairly plastic in its site requirements, meaning that it survives and grows over a wide range of sites and therefore can be used as an indicator of performance for the stringybark group of species wherever E. fastigata can be successfully grown. Historically E. fastigata has been widely planted in New Zealand, unlike many of our stringybark trial species, and so for this project its inclusion is a particular strength.
At the very beginning of the SFF L03-007 species trial the goal was to look at the nationwide survival of the stringybark group of species. This group (stringybarks) was specifically chosen due to higher levels of natural durability of the timber that these species produce, and equally importantly, the ease of which they are able to be sawn and seasoned. Natural durability is becoming increasingly important for the provision of high quality sawn hardwood timber products, and the ability to process them easily and get them to a saleable form efficiently is paramount for the profitability of the fledgling New Zealand hardwood industry. It is the provision of species options to growers who wish to produce naturally durable sawn hardwood timber for sale in the New Zealand market or for export that this project is of real importance. Historically, few of the species that we have trialled have had any applied scientific research performed on them by NZ research institutions, and that which was undertaken was around the trialling of different provenances (families) of candidate species E. muelleriana, E. pilularis and E. gloiboidea at a very limited number of upper North Island trial sites by Scion and its predecessor organisation Forest Research. There was no historical nationwide attempt to trial the stringybark group by our national science providers until the year prior to the L03-007 survival trial plantings, and then it was on a far more limited range of sites than was undertaken in the stringybark survival trials. Previously Eucalyptus species research had mainly centred around the low durability “Ash group” species E. fastigata and E. regnans, and E. nitens a member of the ”blue gum group” which although they can be sawn for hardwood timber production, are primarily grown for pulp or chip export in the New Zealand context.
Now that we have completed this project anyone wishing to become involved in a NZ hardwood industry has an information resource that can guide them in both species choices and the expected growth performance on any chosen site for the species that we have mapped and to a lesser extent the ones that we have not.
This may lead to one of 2 outcomes. Prospective growers may well shift the siting of any potential plantation estate to an area where growth performance of their chosen species can be maximised, or if shifting the physical location is not an option, the choice of which species to grow becomes the key driver in their decision making process. The “what species do I choose for my site” question may well be the most prevalent use of this resource because this project has shown that there are indeed species options for almost every site in New Zealand, irrespective of latitude and to a lesser extent altitude.
One of the key tools in this information resource is the Microsoft excel spreadsheet package that has been developed to display the site data on XY scatter plots. This resource could be added to in the future as data from similar trials becomes available. Whilst it would not be strictly correct to say that all the data from other sites with trees that have a different genetic source or management regime will not skew a plotted output, it must be noted that the power of our analysis technique is simplicity. Anyone who can work out a mean annual growth increment (MAI) for a given trial site can add to their own copy of this spreadsheet package because it is downloadable and open in terms of data entry. We anticipate that in the future we will be able to undertake further analysis including data from other trial series. In this respect getting closer to an ideal answer is little more than a numbers game, the more data you have the closer you are likely to get to having an answer that approaches the reality in the field.
In New Zealand we have a very small forest research community and an even smaller subset of that has a passion for hardwood production. Our project team included a scientist, 2 seed suppliers, three farm foresters, a GIS technician and a leader in the development of our fledgling solid hardwood industry. Whilst we all knew each other prior to this project, working together as a team has reinforced the relationships and shown the interdependence of the individuals involved in what is a very niche area of forestry. The death of a key member of our team part way through the project just reinforced this reality.
Where to from here?
This project is the culmination of 9 years of work. The first part was the establishment of a nationwide set of stringybark species survival trials and was reported in the final report of SFF L03-007.
This current project was essentially the second phase and involved the collection of relevant site factors and growth data from all of the original sites. Physically and logistically this was a big task. Importantly this growth data can now be re-analysed using different techniques and by different groups in the future if the need arises. In a project that is initially undefined in terms of potential outcomes as this one there are always questions raised as the project progresses.
One such question that we thought about was "did we unduly influence any species performance by the limited number of provenances (3) that most species had in the initial species trial?"
Another is "how do we include other data sets into this one at a later date and still produce outputs that are an accurate representative of the reality out there in the field?"
Still another question is "can we refine out GIS maps to more accurately display performance variations that exist across the landscape for any of our mapped species?"
Looking to the future it is obvious that some of the trialled species will play a significant role in any future hardwood forestry in New Zealand. In order to have some chance of success however, an effort needs to be made to obtain a more diverse gene pool for any selected species, plant this diverse gene pool in a number of controlled trial sites and select the best performers to obtain a breeding population that is suited to the needs of the locality and environment in which the trees are expected to grow.
We have a large number of species in our trial plantings, and obtaining seed from the native habitat of eucalypts in Australia to enlarge our gene pool is not a cheap or easy process. Luckily, members of the hardwood eucalypt growing community including the New Zealand Farm Forestry Association (NZFFA) are not working in isolation on this issue, and four of our 6 mapped species already have broadly based provenance collections set up that could produce seed in New Zealand. E. globoidea and E. macrorhyncha have been included in the Dryland forestry initiative genetics collection, and E. muelleriana and E. pilularis are in historical provenance collections that are now managed by Scion. The hardwood growing community within New Zealand will have to seriously look at what other species may be worthy of future intensive work by way of importation of new genetic material and subsequent selection to suit local conditions.
To this end, two other species that had productivity maps produced E. laevopinea and E. youmanii could both be contenders for having broadly based provenance collections made. There are others in the list of species in this project that showed real promise, both due to their performance in this project and in other independent plantings or historical collections. Some of our species had extremely limited numbers of plants available at the time of the original species trail plantings in 2004 and 2005 and so were unable to produce much in the way of statistically valid data. They do however provide some indication of the potential performance of those species and on which sites. Two in particular, E. baxteri which has performed well from Christchurch north and especially in the warm humid sites of the upper north island, and E. blaxlandii which has performed well as far south as the Southland coast and up to high altitude in the North island could both be contenders.
Another future step could be to include any available data from the Dryland forest initiative trial plantings and the Scion stringybark species trials which were initiated at a similar time to the original species trial that this project sourced its data from. Both of these trial groups include many of the same target species, planted in higher numbers but on a more limited range of sites and in some cases completely different localities. Our data is by no means complete and so every extra dot on the map represents an added piece of information to complete the picture. In this manner our mapped outputs can be strengthened and provide higher levels of certainty to the users of this resource.
Further to these potential endeavours is the need to describe an issue that was previously mentioned but that has not been effectively dealt with at all. That is to accurately describe the term “micro site” and what it means for the eucalypt grower. In essence it is the combination of a diverse range of site factors that add up to describe whether any particular site has a higher probability of being successful for a chosen species or group of species. In eucalypt silviculture this can sometimes be the most important factor in the success or failure of a species at any given site, the confounding issue is that not all species react to the same site factors in the same way as can be seen by the mapped outputs of this project. The utilisation of our trial sites for micro site description would be an interesting future use of sites that have now served their purpose in terms the original goals of both the original species survival trial and this project.
The surviving trees in the species survival trials are at the stage where competition between individuals and species in the row plots will start to impact on growth, especially that of sub dominant trees or species. Inevitably mortality will start to occur, and so logically thinning needs to take place if the trials sites are to be managed as a woodlot for future timber production. In terms of the original goals of both this project and the previous one, these trials have now reached the end of their useful lives in terms of data collection and so they will become an interesting part of our landscape and a small source of revenue, when the surviving trees are eventually harvested in the future. It would be fair to say that these trials by their very design have served their purpose well but now it is time to move on from them, as multi species row plot trials have a very finite life in terms of data collection. An advisory note will be sent to all of the trial hosts to this end.