This is free.
Additional Graphical analysis of survey data
There are so many variables in this data it allows many ways of viewing the results. To help with this we have added more graphs to help answer some of the many questions that have been raised.
Volume harvested (t/ha) by Final Crop Stocking ages 26-28yrs only for 26 Woodlots
If we select only the woodlots that were harvested within the age range of 26 to 28 years, we get a lower sample of 26 woodlots, but they generally show the same relationship. For the same stocking, data points that are low will probably be on lower quality sites. This shows the potential impact of site quality and could be a much as 300 tonnes at harvest.
_by_Final_Crop_Stocking_ages_26-28yrs_only_for_26_Woodlots.png)
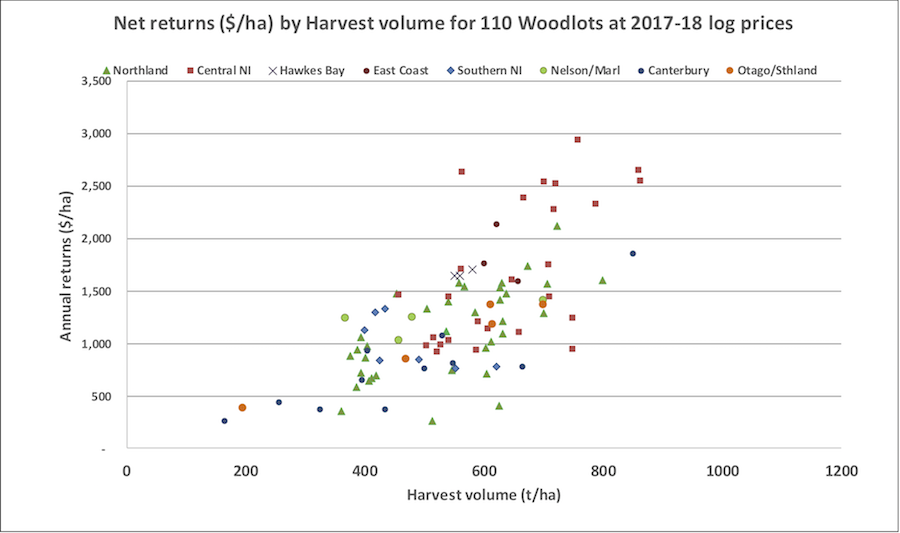
Net returns ($/ha) by Tree age at Harvest for 110 Woodlots at 2017-18 log prices
If we consider the impact of tree age on net returns, we get the following graph. While there is no significant relationship shown (because of many other variables) the average harvest age is 27 years. A significant number have been harvested prior to 25 years of age, and some are older than 35 years.
_by_Tree_age_at_Harvest_for_110_Woodlots_at_2017-18_log_prices.png)
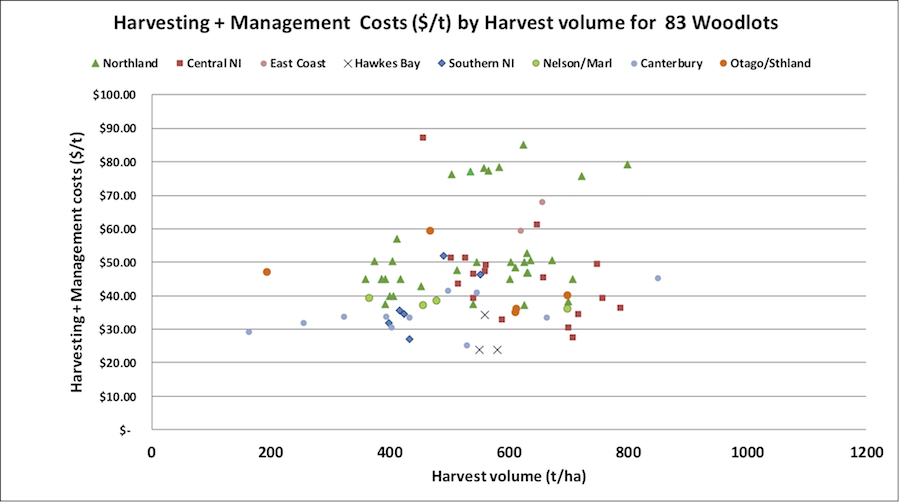
Harvesting & Management costs ($/t) by woodlot size for 83 Woodlots at 2017-18 log prices
If Harvesting costs (cost to log and load on truck) plus harvest management costs are combined and graphed against woodlot size, there is little evidence of a relationship, i.e. costs should reduce slightly with scale of operation. These costs vary significantly and can be affected by terrain, location, soil type, and availability of equipment and labour.
_by_woodlot_size__for_83_Woodlots_at_2017-18_log_prices.png)
Harvesting and Management costs by Harvest volume
Are harvesting costs less if we have higher volumes per hectare? If we combine the harvesting, loading, and harvest management costs and plot them against harvested volume/ha we don’t seem to have a relationship, i.e. higher volume stands don’t seem to result in cheaper logging.
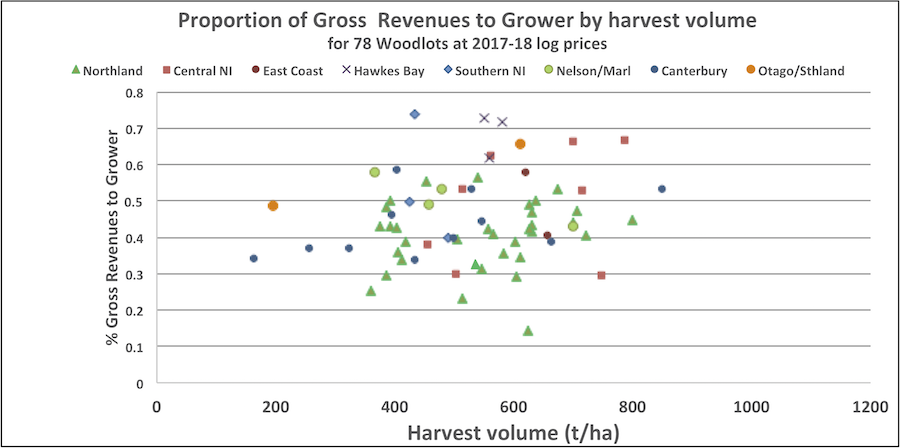
Proportion of Gross Revenues to Grower by harvest volume for 78 Woodlots at 2017-18 log prices
Another useful metric developed is the percentage of revenue returned to the grower, i.e. if we subtract all costs associated with harvesting from the gross returns paid at wharf gate for the logs, what proportion is left to the grower. From the recent data this is currently averaging 43%, i.e. on average more than half the revenue goes to contractors providing services for harvesting, roading, management, and cartage. There is considerable variation in this factor and can range from 25% to 75%.
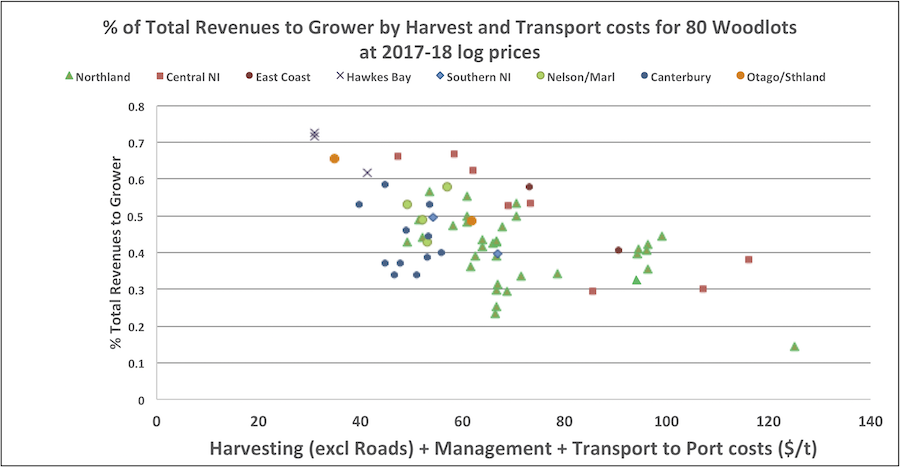
Percentage of Total Revenues to Grower by Harvest and Transport costs for 80 Woodlots at 2017-18 log prices
If we consider what is influencing the proportion of revenues going to the grower, this graph combines all harvest (including management, but excluding roading) and transport costs. This shows a strong relationship with proportion returned to grower. As would be expected, the biggest share of the revenue goes to the grower when costs are minimised.
Annual net return to grower by region and wood lot size
The annual return, per hectare, per year, can be calculated from the net return per hectare divided by the age of harvest. This gives a nominal non-discounted return per year. The average for the 110 woodlots with the right data was $1,150 ha/yr. This is a useful metric to compare with annual net income from other land uses. When plotted against harvested volume it shows a strong relationship; high returns generally require high volumes at harvest.