See also:
This is free.
Report: Small-scale Grower Harvest costs and returns
By Graham West, June 2019.
Acknowledgements
My sincere thanks to all farm foresters and consultants that have contributed data and persevered with my many questions to ensure I had the information recorded correctly. My thanks to the Forest Growers Levy Trust for sponsoring this project and supporting it over an extended period.
Introduction
A previous survey of small-scale forest owners (SSFO) interests (reported in May 2017 Tree Grower) clearly showed a strong interest for more information around the harvesting and marketing segment of forest investment. They also showed an interest in software tools and web delivery of information.
Many farmers provide tales (mostly anecdotal) of woodlot growers receiving poor returns or unethical business practices. Some of this arises from a lack of good benchmark information and general lack of experience in selling forests. It’s often a once-in-a-lifetime experience.
The aim of this project was to collate and provide in an easy to understand format, information that assists small growers at the time of harvest to better engage in the process with knowledge and achieve the best possible outcome. This survey would support this by collating and analysing information on woodlot size and location, roading, harvesting, and transport costs, plus stumpage returns. Where possible to demonstrate the above information in simple graphics and a calculator that allows some understanding of the drivers of costs and returns at harvest for woodlot owners. To present this information at the Annual FFA Conference, make available on a website, and give a summary report in the Tree Grower.
Methods
Collection of data by survey from stakeholders has always been problematic, the issues for the woodlot owners of collating various files and confidential financial records is naturally time consuming. Donating time is an impediment that creates slow or nil responses.
Assured by the earlier work in this area (that was commissioned from within Scion) this project has used several different approaches to improve returns and gain data at sufficient scale.
The various approaches tried have been:
- Engage Harvesting Management Consultants with a series of regional meetings and provide an understanding of the project purposes and gain confidence that confidentiality is assured.
- Send to Harvesting Management Consultants, via email, a request to provide data in the form of Excel template
- Request directly to SSFO, via NZ FFA News Letter, to supply the information in an Excel template
- Request directly to SSFO via NZ FFA’s large (3000 approx) email list with supporting letter from the President of NZFFA and CEO of FOA (using Excel template)
- Request to supply the information via an email Reply (using an embedded form).
Results
The results of the first two steps gave returns from two consultants providing 37 data points (examples of woodlots with adequate information on costs and returns). Follow-up phone calls were made to many consultants and resulted in responses that the market was very busy and would hope to provide data when time permitted. A few declined (some having previously supplied information in 2016) because of confidentiality agreements with clients. Some may still provide something, but a general comment was the information was not stored in an easily accessible dataset and this would take considerable time. While offers were made to pay for staff time or to access their data systems personally, this rich source of information was generally not available. Many large consultancies could process 30-80 woodlots in a year. One large consultancy has been reportedly running over 40+ harvesting gangs. By simple calculation about 25+% of the annual cut is supplied by SSFO (i.e. 8-10 m tonnes/yr), this means approximately 350 - 400 woodlots a year are being harvested. Harvesting consultants are currently turning over about $40+ m/ year, they should be encouraged to put something back.
The request for information to SSFO directly resulted in about 5 useable returns at step 3, and about 10 from step 4. Step 5 has brought forward another 10-15, including using the option to send in by post.
Some of this data appeared illogical and ongoing dialogue is occurring to clarify numbers or to get more. Very few were complete and few straightforward to add to existing data with confidence.
Almost every line of data needed manual input into Excel, followed by resorting, and verification. Simple cross check calculations were applied to check that transcribing errors had not creeped in. When this was done some numbers didn’t meet logical test and where omitted.
Many SSFO do not understand basic terms like “stumpage” or “managed sale”. Histories like thinning regime, or final stocking are occasionally best guesses but often unknown. Some of the recent returns have been for older harvest records (pre 2017) and have been moved into the previous data set collected. Work has been done to try to adjust these numbers to 2018-19 using historic records of log prices and costs. The objective is to put the two data sets together.
Many returns are from lovely people who have been encouraging and are keen to see the report. Comments on their satisfaction with the whole business process are very variable, many commented that it “could be better. They were happy with the harvesting contractor and cartage operators, as opposed to the Harvesting Consultant.
Early results
Data from all stages of this survey have been restructured into a time period and region. Most of the previous data was 2002 – 2016, this has been added to by some of this survey’s return. All recent data is clustered as 2017-18.
The previously used farm forestry districts have been changed to using the MPI National Exotic Forest Description (NEFD) wood supply regions. These are bigger, well recognized, and suit the collation of lower number of returns.
The following figures 1 and 2 give current results of key factors such as stumpage returns for each period by woodlot size and region. Unfortunately, not all regions are represented in both sets. The variation in returns are huge but does indicate a lift in returns between periods and possibly indicates fewer “really poor” returns (less than $10k /ha) have occurred in the last two years. There is little evidence of significant differences in returns between regions.
While there are is no trend in net returns with woodlot size, further analysis will examine (if there is sufficient data) what will happened when effects of the variation; like stocking, terrain, transport distance, etc, are removed by multiple regression analysis.
_by_woodlot_size_from_154_woodlots_in_2002-2016.png)
_by_woodlot_size_from_61_woodlots_in_2017-18.png)
All data combined
The data from the previous survey (154+ returns) has been adjusted to June 2017 values using a quarterly log price index based on MPI average export log prices. This then gives a more powerful dataset to investigate trends and relationships.
The adjustment of costs was considered, but data for this element was found to only go back 8 years. Historic harvesting costs did show increases of $6-7/t over the last eight years (R. Visser, FFR Harvesting Technical Note, 2016).
The result of the indexing gives a data set of 215 points that are based on very similar log prices over the June 2017 to Dec 2018 period. These will be used for the remainder of the analysis. The number of samples, arithmetic average, minimum and maximum (to give range) has been calculated for all variables and shown in appendix 1.
Net returns for 215 woodlots is highly variable and with this larger data set still shows not relationship with woodlot size.
Figure 3 gives net return/ha by woodlot size and does not show any significant difference by region
_by_woodlot_size_for_215_woodlots_at_2017-18_log_prices.png)
Net return by harvest volume was $20,900/ha in the previous data set of 154 samples, with adjustment to 2017-18 log prices and combining all data (215 samples) it now averages $30,000/ha.
Figure 4 provides a distribution graph of the Net Returns by number. There is clearly a very large group that received less than $28,000/ha.
_classes_for_215_woodlots_using_2017-18_log_prices.png)
Figure 5 gives the net return/ha for all data that had a volume/ha recorded. If region is removed as a variable, a model can be fitted to the whole data set as shown in figure 6.
_by_Harvest_volume_for_187_woodlots_at_2017-18_log_prices.png?1562908646)
_by_Harvest_volume_for_187_woodlots_at_2017-18_log_prices_model.png)
If we examine what influences the volume harvested, figure 7 gives the volume harvested by final crop stocking, showing volume dropping off as final crop stocking is reduced below 300 stems/ha.
_by_Final_Crop_Stocking_for_85_woodlots.png)
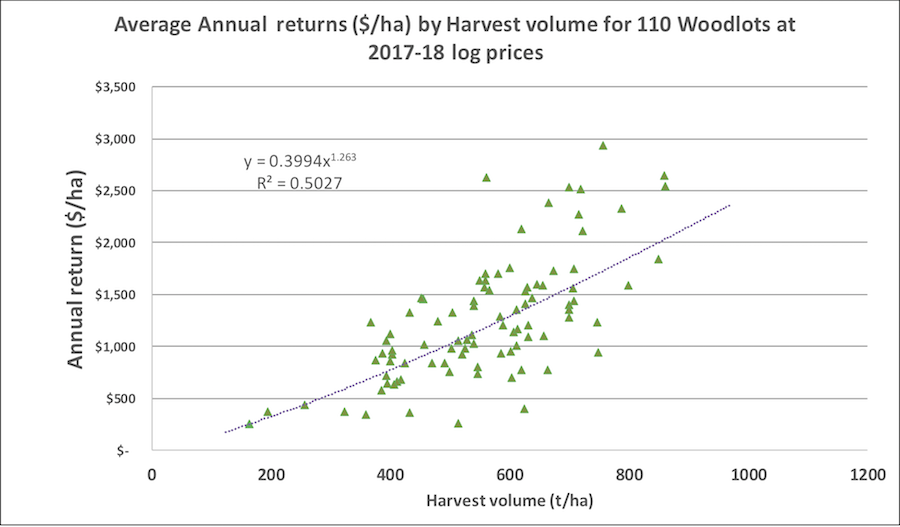
Figure 8 gives average annual return, calculated from the net return divided by the age of harvest, to give the non-discounted return per year. The average for the 110 woodlots with the right data was $1,150 ha/yr.
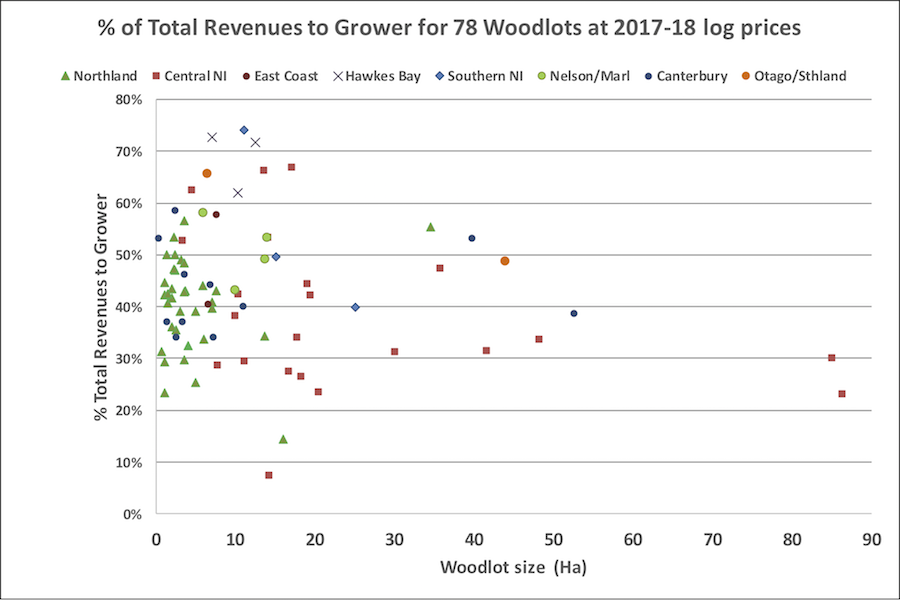
Another metric developed is the percentage of revenue returned to the grower, i.e. if we subtract all costs associated with harvesting from the gross returns paid at wharf gate for the logs, what proport is left to the grower. From the recent data this is currently averaging 43%, i.e. more than half the revenue goes to contractors providing services for harvesting, roading, management, and cartage. There is considerable variation around this average as shown in figure 9.
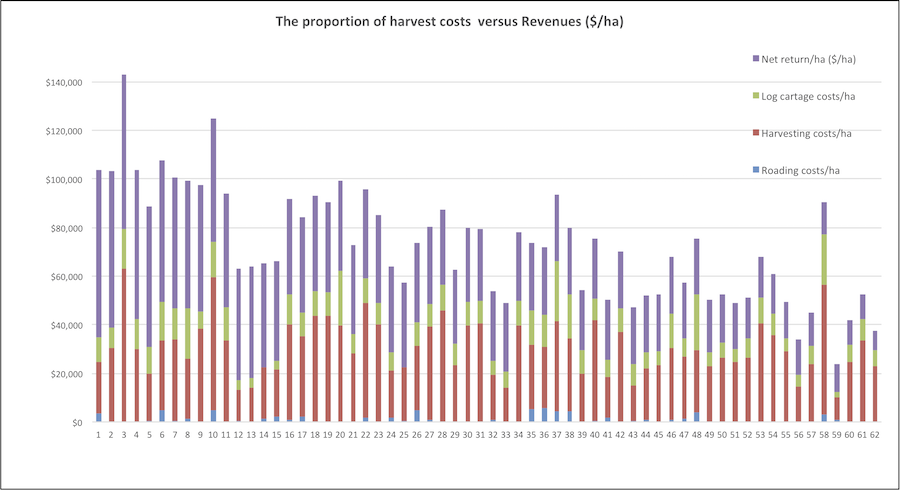
To show how the revenue is distributed to costs and net returns (profits), figure 10 gives results of 61 examples where all the data was provided. The blue at the bottom gives the roading costs. Sometime these were not given or costed very low because the owner made some of the roads. However as recorded on the data roading per hectare seems generally to be a minor cost. Next (in red) is the Logging and Loading costs, including harvest management. Clearly these are the big costs (averaging $28,000/ha) or about 43% of the gross revenues received. Next is log cartage (in green) averaging $8,000/ha, a significant cost that can decimate profits when it rises to over $20,000/ha as in some examples.
Summary of data
The following tables give the average, number of samples, minimum and maximum from the complete data set. Areas highlighted are some of the more important variables.
| Variable | Age at harvest (years) | Area (ha) | Final Stocking (stems/ha) | Total Block Roading costs | Roading costs ($/ha) | Roading costs ($/t) | Cost to Log/ Load/ Manage ($/t) |
Cost to Log/ Load/ Manage ($/ha) |
Total harvest costs for woodlot (excl Roads) | Km to Port | Cartage cost to Port ($/t) | Km to Mill | Cartage cost to Mill ($/t) | Log cartage costs ($/ha) |
|---|---|---|---|---|---|---|---|---|---|---|---|---|---|---|
| Average | 27 | 15 | 320 | $37,924 | $2,300 | $4.0 | $46.1 | $29,024 | $328,265 | 100 | $19.1 | 59 | $14.4 | $10,239 |
| Sample | 111 | 215 | 84 | 47 | 36 | 36 | 83 | 66 | 93 | 74 | 76 | 55 | 47 | 62 |
| Minimum | 14 | 0.3 | 85 | $168 | $129 | $0.2 | $23.9 | $9,178 | $11,536 | 10 | $7.0 | 21 | $5.5 | $2,342 |
| Maximum | 44 | 86.3 | 650 | $326,000 | $9,452 | $18.39 | $87.38 | $63,273 | $2,199,308 | 260 | $55.66 | 160 | $25.59 | $24,592 |
| Variable | Total woodlot Cartage cost | All Harvest- ing (excl Roads) + transport to Port ($/t) |
All Harvest- ing (excl Roads) + transport to mill ($/t) |
A Grade price ($/t delivered to port gate) | Pruned log % | Total woodlot harvested Volume (t) | Volume per ha (t/ha) | Net return to grower for Total block | Net return per tonne ($/t) | Net return/ha ($/ha) | % of Revenues (non adjusted) paid to grower | Adjusted Net returns ($/ha) using June 2017 to May 2019 log prices | Adjusted Nominal annual returns ($/yr/ha) |
|---|---|---|---|---|---|---|---|---|---|---|---|---|---|
| Average | $75,918 | $64.7 | $51.4 | $122.4 | 21% | 7,594 | 562 | $360,335 | $43.3 | $25,528 | 43% | $30,063 | $1,156 |
| Sample | 32 | 80 | 30 | 68 | 75 | 188 | 188 | 210 | 183 | 215 | 81 | 215 | 110 |
| Minimum | $2,130 | $30.9 | $29.3 | $82.0 | 1% | 255 | 124 | $1,627 | $4.6 | $1,485 | 7% | $2,015 | $56 |
| Maximum | $815,228 | $125.00 | $68.20 | $152.00 | 43% | 51,269 | 967 | $4,173,809 | $104.1 | $76,293 | 74% | $98,419 | $2,941 |
Discussion
Data collection
Collection of this type of data is challenging with often too many surveys competing for the precious time of growers and farmers. Some lessons have been learnt; the method of getting a return via the email “Reply” option is simplest, some of those who responded explained they don’t have the computer skills for Excel or attachments to emails.
While Harvesting Management Consultants have all the necessary data, we need to figure out a way to get them to contribute to a database as a routine reporting requirement in the Harvesting Contract. They frequently report to being very busy and not having the data organised in systems that facilitate the type of data requested. Obviously, there is a cost to collating data within businesses, and I would suggest we explore how to pay for these costs. In the meantime as harvesting continues, summaries from woodlots could be requested from consultants (in the format used in this survey) and sent to admin@nzffa.org.nz.
Further analysis
Further analysis of the current data is possible below, using Survey data and Graphs. The intention is to reveal more understanding of what drives the variation of returns and how we can offer benchmark data or models that assist SSFO decision making at time of harvest.
Survey data
The reader can filter the dataset by relevant criteria like region, regimes, age at harvest, ground slope, area harvested and transport distance. This limits the data to a smaller more relevant set and gives the user a report of a range of likely values and outcomes.
Click here for the interactive table. The user can filter the table according to category.
Graphs
- Volume harvested (t/ha) by Final Crop Stocking ages 26-28yrs only for 26 Woodlots
- Net returns ($/ha) by Tree age at Harvest for 110 Woodlots at 2017-18 log prices
- Harvesting & Management costs ($/t) by woodlot size for 83 Woodlots at 2017-18 log prices
- Harvesting and Management costs by Harvest volume
- Proportion of Gross Revenues to Grower by harvest volume for 78 Woodlots at 2017-18 log prices
- Percentage of Total Revenues to Grower by Harvest and Transport costs for 80 Woodlots at 2017-18 log prices
- Annual net return to grower by region and wood lot size