

PESTS AND DISEASES OF FORESTRY IN NEW ZEALAND
Cyclaneusma trials
Scion is the leading provider of forest-related knowledge in New Zealand
Formerly known as the Forest Research Institute, Scion has been a leader in research relating to forest health for over 50 years. The Rotorua-based Crown Research Institute continues to provide science that will protect all forests from damage caused by insect pests, pathogens and weeds. The information presented below arises from these research activities.
From Forest Health News 59, December 1996- January 1997.
Regional variation in incidence and severity of Cyclaneusma is well recognised, but regional disease/growth loss relationships had not been quantified. So in late 1994, five sites were chosen to measure the effect of Cyclaneusma on tree growth. The selected sites were in Otago Coast Forest; Golden Downs (Nelson); Puketiro Forest (Upper Hutt); Ruatoria Forest (East Cape); and Mahurangi Forest (Northland). Five 20-tree plots were established at 3 sites in 1994, an additional trial was established at Kaihu Forest near Dargaville in 1995, and plots were established at Ruatoria and Rabbit Island in Nelson in 1996. Each 20-tree plot consisted of 10 trees selected as susceptible to Cyclaneusma and 10 trees of similar size and form not infected by Cyclaneusma. Disease and DBH growth assessments were carried out during October/November. At Puketiro Forest, trees chosen as susceptible had average disease levels of 61% over the last three years; compared to 5% for the "healthy" trees. Diameter increment from 1994 to 1996 was 37 mm for the susceptible trees and 56 mm for the "healthy" trees. At Mahurangi, disease levels averaged 69% for the susceptible trees and 13% for the "healthy" trees. Respective DBH increments were 50 mm and 73 mm. Otago Coast had lower disease levels of 33% (susceptible) compared to 3% ("healthy"). Respective increments were 49 mm and 54 mm. At Kaihu, disease levels averaged 64% (susceptible) over 1995 and 1996 with an increment of 26 mm, and 6% for "healthy" trees which grew 33 mm.
(Lindsay Bulman, FRI)
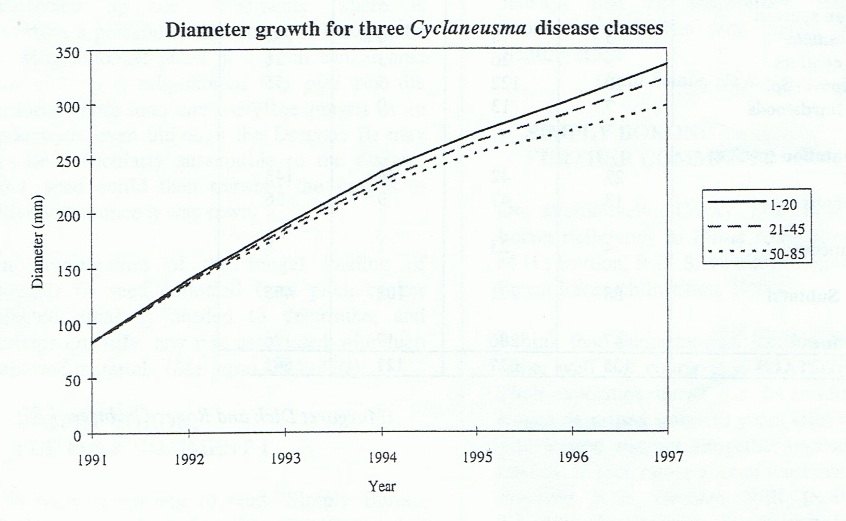
From Forest Health News 70, December 1997 - January 1998.
Growth data from a permanent sample plot in Northland were taken from 1991 to 1997 and individual trees categorised according to average Cyclaneusma level from 1995 to 1997. The categories were: average disease level 1-20%, 21-45% and over 50%. The plot was severely affected, with 33% of the trees (17 out of 52) having an average disease level between 50 and 85%. Just under half the trees (48%) had an average disease level of 20% or less. In 1991 all three groups had similar DBH. From 1993 (when the trees were 6 years old) onwards growth of each group diverged, in 1997 the trees with low disease levels had an average DBH of 336 mm. The group with moderate disease levels averaged 323 mm, compared with 299 mm for the group with high disease levels. If such growth loss continues stand volume will be significantly affected.
(Lindsay Bulman, FRI)
From Forest Health News No. 48, November 1995.
Regional variation in the incidence and severity of Cyclaneusma is well recognised but not quantified. So in late 1994 sites were chosen to test the assumption that disease-growth loss relationships do not differ between regions. The selected sites were in the Otago Coast Forest; Puketiro Forest (Upper Hutt); and Mahurangi Forest (Northland). Five plots of twenty 7-year-old trees were established in each forest. In each plot ten trees were selected as susceptible to Cyclaneusma and each of these were paired with a healthy tree of similar size and form. Disease and DBH growth assessments were carried out during October and November 1995. At Puketiro Forest the trees chosen as susceptible had average disease levels of 56% (1994) and 64% (1995); compared with 3% and 7% for the "healthy" trees. Diameter increment from 1994 to 1995 was 19 mm for the susceptible trees and 24 mm for the "healthy" trees. In Mahurangi Forest the disease levels averaged 61% (1994) and 74% (1995) for the susceptible trees, 7% and 18% for the "healthy" trees with DBH increments of 32 mm and 43 mm respectively. Otago Coast Forest had lower disease levels of 38% and 32% for susceptibles, 1% and 2% for "healthy" trees, and respective increments of 28 mm and 29 mm.
(Lindsay Bulman, FRI )
This information is intended for general interest only. It is not intended to be a substitute for specific specialist advice on any matter and should not be relied on for that purpose. Scion will not be liable for any direct, indirect, incidental, special, consequential or exemplary damages, loss of profits, or any other intangible losses that result from using the information provided on this site.
(Scion is the trading name of the New Zealand Forest Research Institute Limited.)