This is free.
Results of survey for small-scale forest harvesting
Graham West, New Zealand Tree Grower August 2019.
This project was aimed at improving the knowledge and investment experience of small-scale forest owners during the harvesting phase. The research used input from farm foresters and harvesting management consultants over a five-year period. A previous survey in 2015 and 2016 had been successful in collating significant data from over 150 observations on harvesting income and costs. Two years later, after a period of sustained log price rises, it was decided to repeat the process with funding from the Forest Growers Levy Trust.
However, the response to the recent requests for data has been disappointing despite changing the collection method several times. About 60 data points have been collated and some useful insights are emerging, such
as a general rise in nett returns in the last two to three years. This is probably due to the recent consistent high export log prices. The variability of nett returns remains high and is an important finding which supports the often negative stories from investors who are at the low end of the range for various reasons.
Location, location, location
The data from the previous survey has been adjusted to June 2017 values using a quarterly log price index based on Ministry for Primary Industries average export log prices. This gives more useful data to investigate trends and relationships. The main reasons for better returns to growers has been found to be the volume per hectare harvested, the final crop stocking and harvesting costs. Differences by regions in these factors do not appear to be significant.
A useful measurement for a grower in the future on how the harvest has gone may be the percentage of total revenue returned to them. On average this was found to be 43 per cent for the total data.
This study helps explain that returns will be low if harvest volumes are down and if some of the major causes of high costs are present, such as location within the property, the choice of terrain affecting harvesting costs, roading and distance to a public road. Transport distance to market can be quite a large cost at around 24 cents a tonne per kilometre.
The level of forestry income for some growers in this survey has been very good and allows factual information to be presented to investors, bankers and accountant to show when most major costs are mitigated. Small-scale forest investment can be very good. However, a simple real estate mantra best applies to forestry, always consider location, location and location.
More information needed
A previous survey of the interests of small-scale forest owners reported in May 2017 Tree Grower clearly showed a strong interest for more information around the harvesting and marketing segment of forest investment. They also showed an interest in software methods and information to be made available on the web.
Many farmers provide mostly anecdotal tales of woodlot growers getting poor returns or unethical business practices. Some of this is from a lack of good benchmark information and a general lack of experience in selling forests. It is often just once-in-a-lifetime.
The aim of this project was to collate and provide in an easy to understand format, information which helps small-scale forest growers at the time of harvest to have better involvement in the process and achieve the best possible result. The survey would support this by collating and analysing information on woodlot size and location, roading, harvesting and transport costs, as well as stumpage returns.
Where possible the above information would be demonstrated in simple graphics and a calculator which allows some understanding of the causes of costs and returns at harvest for woodlot owners. This information was also to be presented at annual NZFFA Conference, made available on the NZFFA website NZFFA website with a summary report in the Tree Grower.
Getting the data from growers
Collection of survey data has always been problematic with the concerns from the woodlot owners of collating various files and confidential financial records being time-consuming. Donating time is an impediment which creates slow or no responses.Assured by the earlier work in this area which was commissioned from within Scion, this project has used several different methods to improve returns and obtain data at sufficient scale.
The various methods tried have been −
- Engage harvesting management consultants with a series of regional meetings and provide an understanding of the project purposes and gain confidence with confidentiality
- Send a request via email to harvesting management consultants to provide data in the form of an Excel template
- Directly request small-scale forest owners, via the NZFFA newsletter, to supply the information in an Excel template
- Directly request small-scale forest owners, via NZFFA’s email list, using a supporting letter from the NZFFA President and the CEO of the NZ Forest Owner’s Association
- Request information via an email reply using an embedded form.
The results
The results of the first two steps gave information from two consultants providing 37 data points and examples of woodlots with adequate information on costs and returns. Follow-up phone calls were made to many consultants and resulted in responses that the market was very busy and they would hope to provide information when time permitted.
A few consultants declined, some having previously supplied information in 2016, because of confidentiality agreements with clients. Some may still provide information, but a general comment was that the information was not stored in easily accessible data and to supply it would take considerable time.While offers were made to pay for staff time or to access their data systems personally, this source of information was generally not available.
Harvesting 400 woodlots a year
Many large consultancies could process between 30 and 80 woodlots in a year. One large consultancy has been reportedly running over 40 harvesting gangs. By simple calculation that means about 25 per cent of the annual cut is supplied by small-scale forest owners, amounting to around eight to 10 million tonnes a year. This means approximately 350 to 400 woodlots a year are being harvested. Harvesting consultants are currently turning over about $40 million a year and they should be encouraged to put something back.
The request for information directly from small-scale forest owners resulted in about 30 useable replies. Some of this data appeared illogical and discussion is taking place to clarify numbers or to get more information. Very few replies were complete and not many were straight forward enough to add to existing data with confidence.
Almost every line of data needed manual input into Excel, followed by re-sorting and verification. Simple cross-check calculations were applied to check that transcribing errors had not crept in. When this was carried out some numbers did not meet a logical test and were omitted.
Many small-scale forest owners do not understand basic terms such as stumpage or managed sale. Histories such as a thinning regime or final stocking are occasionally best guesses but often unknown. Some of the recent returns have been for older harvest records before 2017 and have been moved into the previous data collected. Work has been carried out to try to adjust these numbers to 2018/19 using historic records of log prices and costs. The objective is to put the two sets of data together.
Many replies are from people who have been encouraging and are keen to see the report. Comments on their satisfaction with the whole business process are very variable with many commenting that it could be better. They were happy with the harvesting contractor and cartage operators, as opposed to the harvesting consultant.
Early results
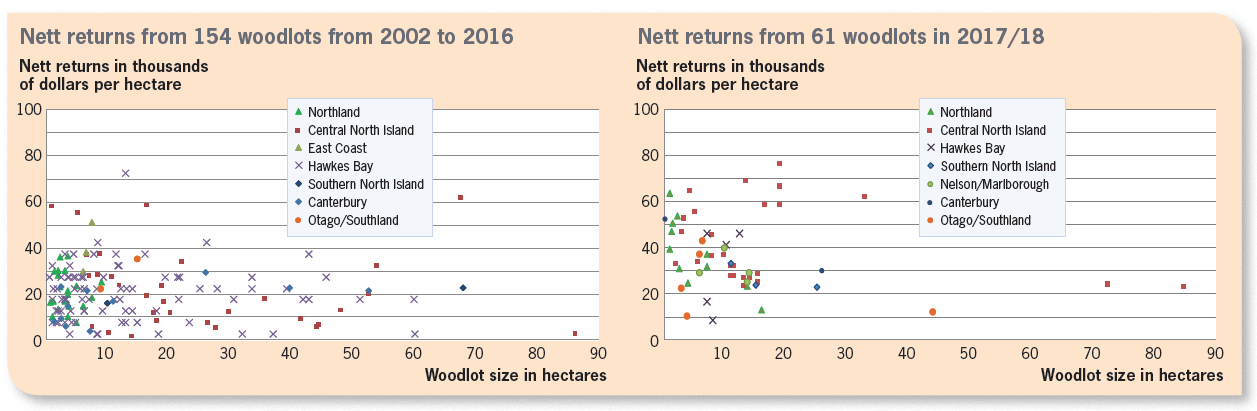
Data from all stages of this survey have been restructured into a time period and region. Most of the previous data was from 2002 to 2016 which has been added to by some of this survey’s return. All recent data is clustered as 2017/18. The previously used farm forestry districts have been changed to use the National Exotic Forest Description wood supply regions. These are bigger, well recognised and suit the collation of lower number of returns.
The following two graphs give current results of the main factors such as stumpage returns for each period by woodlot size and region. Unfortunately, not all regions are represented in both sets of results. The variation in returns are large but there is a rise in returns between periods and possibly indicates fewer really poor returns of less than $10,000 a hectare have taken place in the last two years.
There is little evidence of significant differences in returns between regions. While there are no trends in nett returns with woodlot size, further analysis will examine if there is sufficient data to determine what will happen when the effects of variation such as stocking, terrain and transport distance are removed.
All data combined
The data from the previous survey of over 154 returns has been adjusted to June 2017 values using a quarterly log price index based on Ministry for Primary Industries average export log prices. This then gives a more useful information to investigate trends and relationships.
The adjustment of costs was considered, but data for this was found to only go back eight years. Historic harvesting costs did show increases of six to seven dollars a tonne over the last eight years.
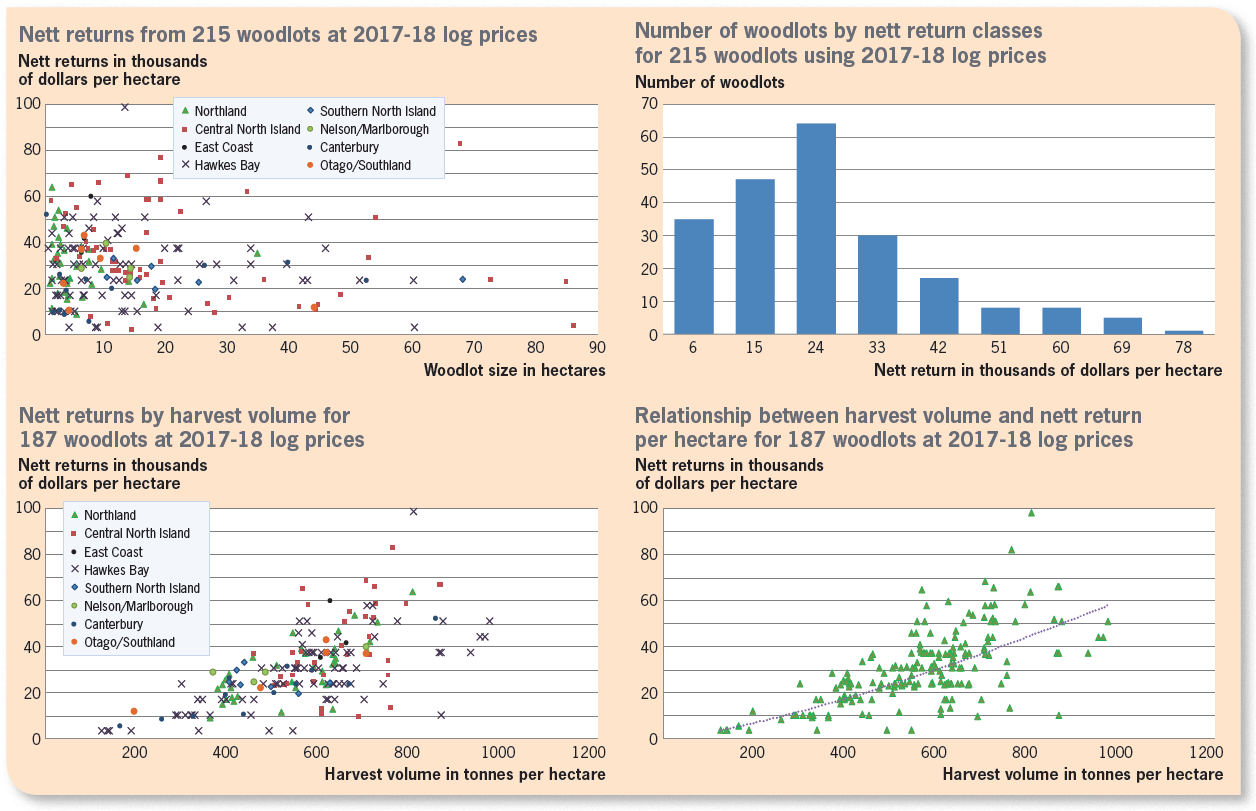
The result of the indexing gives data with 215 points which are based on very similar log prices over the June 2017 to December 2018 period. These will be used for the remainder of the analysis. The number of samples, arithmetic average, minimum and maximum have been calculated for all variables. Nett returns for the 215 woodlots are very variable and with this larger amount of data still shows no relationship with woodlot size. The table below gives the average, number of samples, minimum and maximum from the complete data. Areas highlighted are some of the more imported variables.
Summary of data
The following table gives the average, number of samples, minimum and maximum from the complete data. Areas highlighted are some of the more important variables.
| Variable | Age at harvest in years | Area in hectares | Final Stocking in stems per hectare | Cost to log, load and manage per tonne | Roading costs per hectare | Roading costs per tonne | Log and load costs per hectare | Log cartage costs per hectare | Kilometres to port | Cartage cost to port per tonne | Kilometres to the mill | Cartage cost to the Mill in dollars per tonne |
|---|---|---|---|---|---|---|---|---|---|---|---|---|
| Average | 27 | 15.21 | 320 | $46.09 | $2,300 | 4.01 | $29,024 | $8,464 | 100 | $19.07 | 59 | $14.37 |
| Number | 111 | 215 | 84 | 83 | 36 | 36 | 66 | 62 | 74 | 76 | 55 | 47 |
| Minimum | 14 | 0.3 | 85 | $23.93 | $129 | $0.20 | $9,178 | 10 | $7.00 | 21 | $5.50 | |
| Maximum | 44 | 86 | 650 | $87.38 | $9,452 | $18.39 | $63,273 | $24,592 | 260 | $55.66 | 160 | $25.59 |
| Variable | All harvesting excluding roads and transport to port in dollars per tonne | All harvesting excluding roads plus transport to the mill in dollars per tonne | A grade logs in dollars per tonne delivered to port gate | Pruned log percentage | Total volume in tonnes | Volume in tonnes per hectare | Total block nett stumpage | Nett dollars per tonne | Nett return per hectare | Percentage of revenue paid to grower | Adjusted nett returns to 2017-18 |
|---|---|---|---|---|---|---|---|---|---|---|---|
| Average | $64.69 | $51.38 | $122.43 | 21% | 7,594 | 562 | $360,335 | $43.30 | $25,528 | 43% | $30,063 |
| Number | 80 | 30 | 68 | 75 | 188 | 188 | 210 | 183 | 215 | 81 | 215 |
| Minimum | $30.93 | $29.32 | $82.00 | 1% | 255 | 124 | $1,627 | $4.60 | $1,485 | 7% | $2,015 |
| Maximum | $125.00 | $68.20 | $152.00 | 43% | 51,269 | 967 | $4,173,809 | $104.10 | $76,293 | 74% | $98,419 |
Average $30,000 a hectare
Nett return by harvest volume was $20,900 a hectare in the previous set of 154 samples, with adjustment to 2017/18 log prices. Combining all 215 samples gives an average of $30,000 a hectare. The distribution graph of the nett returns by number shows that there is a large group who received less than $28,000 a hectare.
The average annual return, calculated from the nett return divided by the age of harvest, gives the non- discounted return each year. The average for the 110 woodlots supplied with the right data was $1,150 a hectare each year.
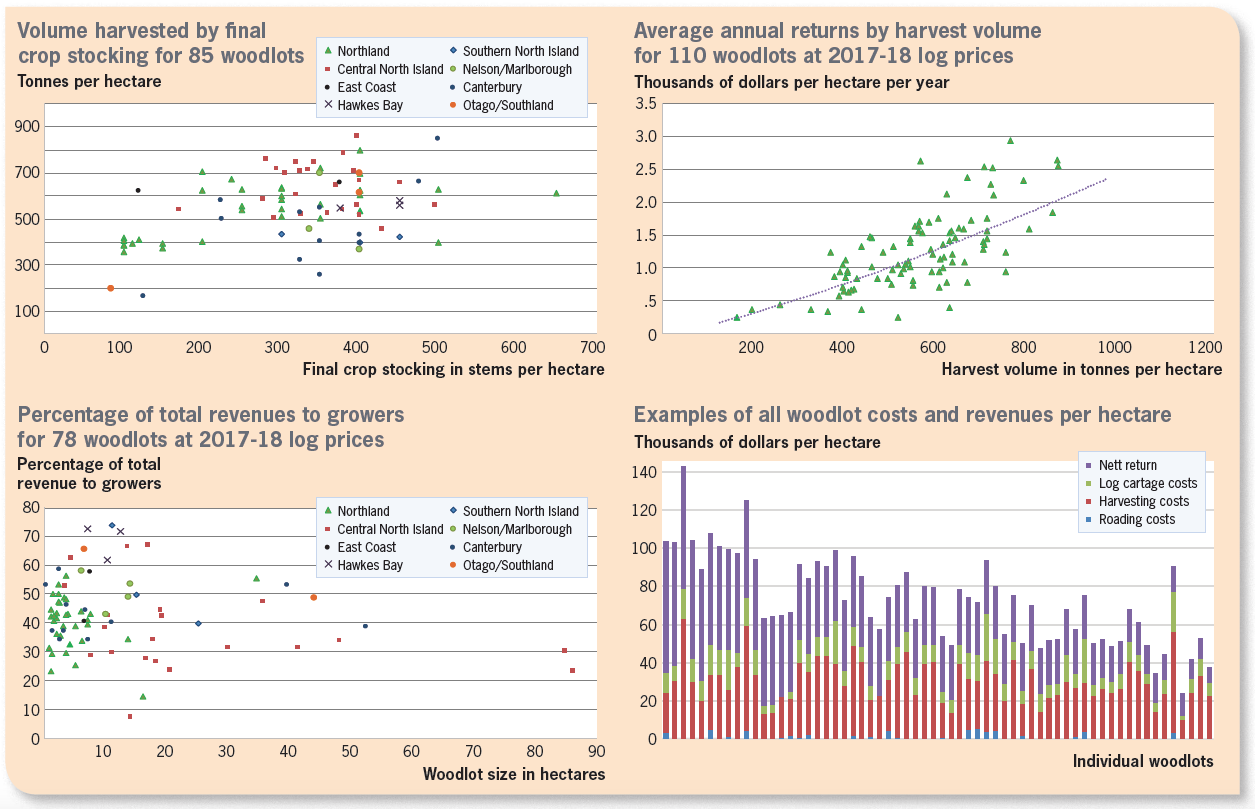
Another measurement developed is the percentage of revenue returned to the grower. That is, if we subtract all costs associated with harvesting from the gross paid at wharf gate for the logs, what proportion
is left to the grower. From recent data this is currently averaging 43 per cent. It means that more than half the revenue goes to contractors who provide services for harvesting, roading, management and transport. There is considerable variation around this average.
The bar graph shows how the revenue is distributed to give costs and nett returns or profit. The figures come from the 61 examples where all the data was provided. The blue at the bottom of the bars gives the roading costs. Sometime these costs were not given, or costed very low because the owner made some of the roads. However, as recorded on the data, roading per hectare seems generally to be a minor cost.
In red are the logging and loading costs, including harvest management. These are the big costs averaging $28,000 a hectare, or about 43 per cent of the gross revenue received. Log transport is in green, averaging $8,000 a hectare. It is a significant cost which can decimate profits when it rises to over $20,000 a hectare as it does in some examples.
Data collection and further analysis
Collection of this type of data is challenging because too many surveys are often competing for the precious time of growers and farmers. Some lessons have been learned. Getting a reply via email is the simplest option, but some of those who responded explained they do not have the computer skills for Excel or attachments to emails.
Harvesting management consultants have all the necessary data, but we need to work out a way to get them to contribute to a database as a routine reporting requirement in the harvesting contract. They frequently report to being very busy and not having the data organised in systems which help them respond to the requests. Obviously, there is a cost to collating data within businesses and I would suggest we explore how to pay for these costs. In the meantime, as harvesting continues, summaries from woodlots could be requested from consultants in the format used in this survey and sent to admin@nzffa.co.nz.
Further analysis of the current data is possible, but the limits of this article means that many graphs cannot be shown. The intention is to reveal more understanding of what causes the variation of returns and how we
can offer benchmark data or models which help the decisions of small-scale forest owners at the time of harvest. A possible effective way is to put this data on the NZFFA website with all the graphs and to allow users to filter the data by relevant criteria such as region, regimes, terrain, roading distance and transport distance. This would limit the data with any recent updates and give the user a report of a range of likely values and outcomes.
My thanks to all farm foresters and consultants who have contributed data and persevered with my many questions to ensure I had the information recorded correctly. Thanks also to the Forest Growers Levy Trust for sponsoring and supporting this project.