
This is free.
Mapping wind risk for New Zealand’s plantation forests
Les Dowling, New Zealand Tree Grower May 2023.
New Zealand’s plantation forests appear to be facing increasing climate-related risks. Wind damage is the most important natural non-biological risk, affecting nearly twice as much forest area as fires. To help with this a research project, funded by the Forest Grower’s Levy, has modelled and mapped wind risk for production forests across the country.
The aim is to help foresters plan and manage their forests more effectively while also expanding our knowledge on this complex subject. By estimating risk across New Zealand, this project found that lower stocking tended to have a higher risk of wind damage. However, there were some exceptions to this rule in specific locations. Soil depth, exposure, and windiness all played a part in the risk levels.The results showed different location-specific patterns between low and high-stocked regimes, and in the end, there were no strong or simple relationships to describe.
While the findings were complex, the maps produced in this project help location-specific forest management around wind risk during the forest establishment, planning and harvesting stages. Although there are no concrete forest management implications just yet, the maps can help foresters make more informed site-specific decisions about managing forests.
The probability of wind damage described in this project will be mapped and reported using the online Treefarmer software.That means anyone can access these results for their forests and be more aware of managing their risks.We hope this project will help forest investors avoid areas of high wind risk in the future.
Background
As the frequency of extreme weather increases, insurance premiums are on the rise and coverage requirements are becoming stricter.That is why it is important to investigate the likelihood and causes of loss using the latest methods available.
Small-scale forest growers, who rely heavily on insurance to mitigate risk, are particularly affected by these changes.With the Emissions Trading Scheme drawing in new forest investors, the small-scale forest area is growing. For these growers, wind cover is a crucial aspect of risk management. Around 80 per cent of insured small forests, those under 2,000 hectares, include wind cover, according to PF Olsen insurance scheme data.
One of the aims of this project is to help forest growers make smarter choices when it comes to insurance. By giving a detailed assessment of the likelihood of wind damage on a fine scale, this research provides critical information which can support these important decisions.To achieve this, we built on previous studies by Scion, including one in 2015 that assessed the regional risk of wind damage for production forests and another in 2017 which looked at the best stocking rates for different areas. Using those mapping methods, we have tailored this approach to focus specifically on the risk of wind damage.
Our findings show that wind risk patterns vary by location.While on average, lower stocking had a higher risk, exceptions exist at specific places, with factors such as soil depth, exposure, and windiness play significant roles.While the trends are complex, the maps produced can support location-specific forest management and risk assessment, ultimately helping owners of small forests make informed decisions about insuring their forests.These probability values will be added to the online Treefarmer, making them accessible to anyone who needs them.
Blowing them down
To understand how different forest management techniques and locations affect wind damage, we had to run complex simulations.We modelled the growth of trees, predicted wind speeds and simulated what would happen if those trees were hit by strong gusts.Then we
took all that data and used it to create maps showing how likely forests are to be damaged by wind.
We found that soil depth and forest productivity are important factors for predicting the critical wind speed for forest damage, while elevation, location, and exposure play a big role in predicting the distribution of wind gust speeds. By combining this information, we were able to calculate the probability of forests being damaged by wind.
Critical wind speed
Forestgales, a wind risk model developed in the United Kingdom, was used to estimate the critical wind speed for forest damage in this project.This model, which has been used for previous wind risk estimates in New Zealand, measures wind forces on trees in wind tunnels and simulates their toppling or snapping. What is impressive about this model is that it includes species- specific information, which allows for the calculation of how much force trees can resist before breaking or falling. Recent versions of the model even include settings for radiata pine, making it an excellent fit for this project.
For data used in the wind risk model, forest variables such as stocking, height and diameter were predicted using a large forest pre-harvest inventory from PF Olsen.
Using these with the wind risk model, we calculated the critical wind speed for forest damage for trees at age 28 over a range of forest growth rates.We then derived information for each soil depth class, which were able to obtain almost all the detail in the critical wind speed model results and allowed us to map them.
We then mapped critical wind speed using forest productivity maps and soil depth maps from the New Zealand Land Resource Inventory.We mapped critical wind speed for forests thinned to 350 stems a hectare and for forests planted and left at 1,000 stems a hectare.
Wind speed distribution
To estimate the likelihood of wind damage in New Zealand forests, we needed predictions of wind gust speeds across the country.We obtained data from 40 NIWA weather stations and calculated wind speed distribution and related them to elevation, location and exposure.To calculate exposure, we used a method based on both the recently updated standard for building wind resistance and previous UK research on how exposure affects forest wind damage.The results accounted for over 80 per cent of the variation in wind gust speed distribution at the weather stations.This allowed us to produce a map of parameters for wind gust speed distributions.
Probability
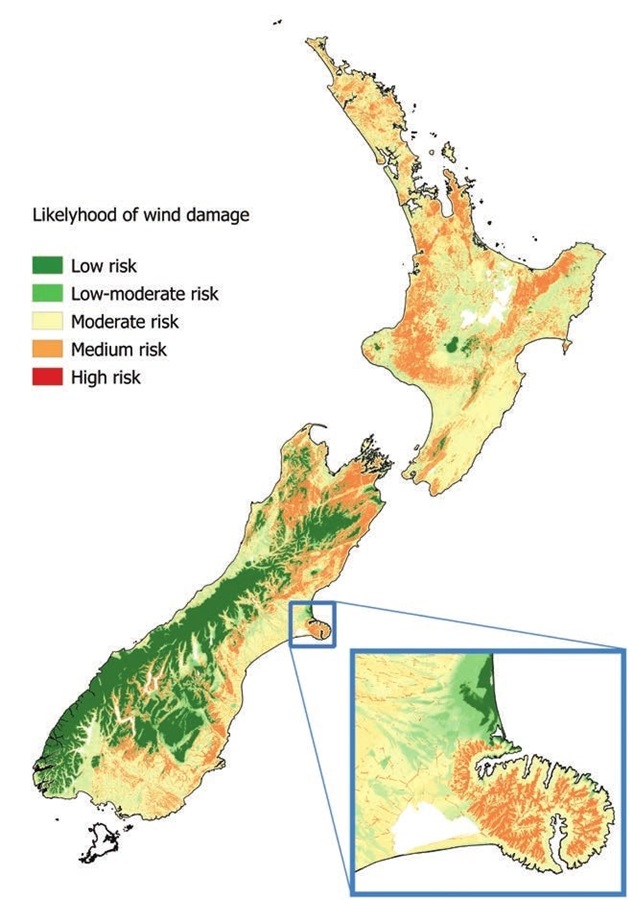
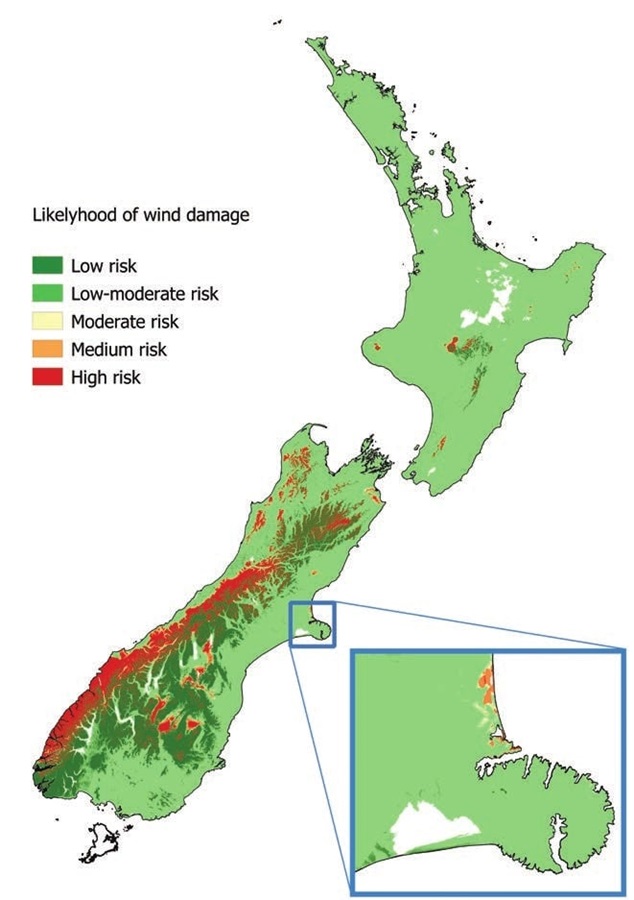
Using our maps of critical wind speed for forest damage and wind speed distributions, we were able to calculate the probability of a forest being blown over in its 28th year for low-stocked and high-stocked forest management regimes. By crunching more numbers, we produced a map with a resolution which is detailed enough for individual stand planning using Treefarmer.
For a closer look at the differences between low and high-stocked regimes, we zoomed in on Bank’s Peninsula and Christchurch city, shown in the expanded areas on the maps.This region provides an excellent example of the contrast between the two management regimes.
We found that the low-stocked regime consistently has a lower risk of wind damage along the coast, while the high-stocked regime has distinct areas of higher wind risk where forest volume productivity was lower and trees were predicted to be more slender.This illustrates how our wind risk model depends on specific aspects of the input data, such as a drop in volume productivity across an area where height growth was constant. It also highlights some of the assumptions built into the model, such as the relationship between tree diameter and canopy closure.
Creating more questions than answers
In our analysis, we found that on average, forests managed under the low-stocked regime had a higher probability of wind damage compared to those managed under the high-stocked regime. However, there were exceptions to this trend in different locations, as illustrated.The likelihood of wind damage was influenced by factors such as forest productivity, soil depth, exposure and windiness, all of which varied across different locations.
Despite the complex interplay of these factors, the probabilities of wind damage for low and high-stocked regimes were found to be very small.They were much lower than the historical rate of wind damage.While this difference could be due to various factors, such as differences in wind speed assumptions or forest age and management practices, it highlights the need to test the whole system against observed rates of wind damage.
Fortunately, previous work has already been carried out. Researchers from the New Zealand School of Forestry have compiled regional records of forest wind damage between 1945 and 2010 across New Zealand, and an analysis of this was published in a scientific journal in 2013. By calibrating our system against this historical data, we can more accurately evaluate the risk of wind damage and make more informed decisions about forest valuations.
Although the components of our wind risk analysis system are robust and our simplified relationships were able to obtain the detail in the results, further calibration work would improve our ability to predict the likelihood of wind damage in different locations. Overall, this research provides valuable insights into which forest sites might be more at risk and the complex factors that contribute to forest wind damage. Future research will be able to refine those to be more precise probability estimates.
Using the results
This project set out to help forest growers plan for and minimise the effect of wind damage, including the option to insure forests.The result was a detailed wind risk model for two forest management regimes, mapped out with good precision. Forest managers can now access the results via the web based Treefarmer at treefarmer.fgr.nz. Here comparisons can be made on the likelihood of damage between high and low stocking regimes at various locations.With this information forest managers can make more better decisions about forest location, stocking, and rotation length to create more resilient forests.
This project has been managed and funded by the Small and Medium Enterprises Committee under the Forest Growers Levy Trust.The research has been completed by M E Research and PF Olsen.
Les Dowling is a research consultant at M E Research.