Mapping the productivity of radiata pine
David Palmer, Michael Watt, Mark Kimberley, Barbara Höck, Tim Payn and David Low, New Zealand Tree Grower May 2010.

Forest owners, investors and policy makers all want to know the spread and productivity of New Zealand’s current and future radiata plantation. David Palmer, a geo-spatial analyst at Scion, has combined advanced statistical techniques with mapping technology to predict radiata 300 Index and Site Index for any location in New Zealand. The 300 Index is an index of volume mean annual increment, and the Site Index is for height and growth.
The map of Site Index and 300 Index was built using growth measurement data from trees in 1,146 radiata pine permanent sample plots, planted between 1975 and 2003. The data was combined with a number of climate, land use, terrain and environmental variables to predict forest productivity under a range of conditions.
National forest productivity
The average Site Index for the New Zealand plantation estate was 30.4 metres and the national average 300 Index was 27.4 cubic metres per hectare each year. Given this national average, and assuming a mean rotation length of 28 years, it translates into a total stem volume of 767 cubic metres, or 575 cubic metres of merchantable stem volume allowing for 15 per cent breakage and 10 per cent unstocked area.
The analysis showed that both 300 Index and Site Index were mainly related to air temperature and soil water balance and these were major reasons behind the development of the model. The big question lies in the accuracy. The short answer is that it is surprisingly accurate. It explained 58 per cent and 67 per cent of the variation for 300 Index and Site Index, respectively.
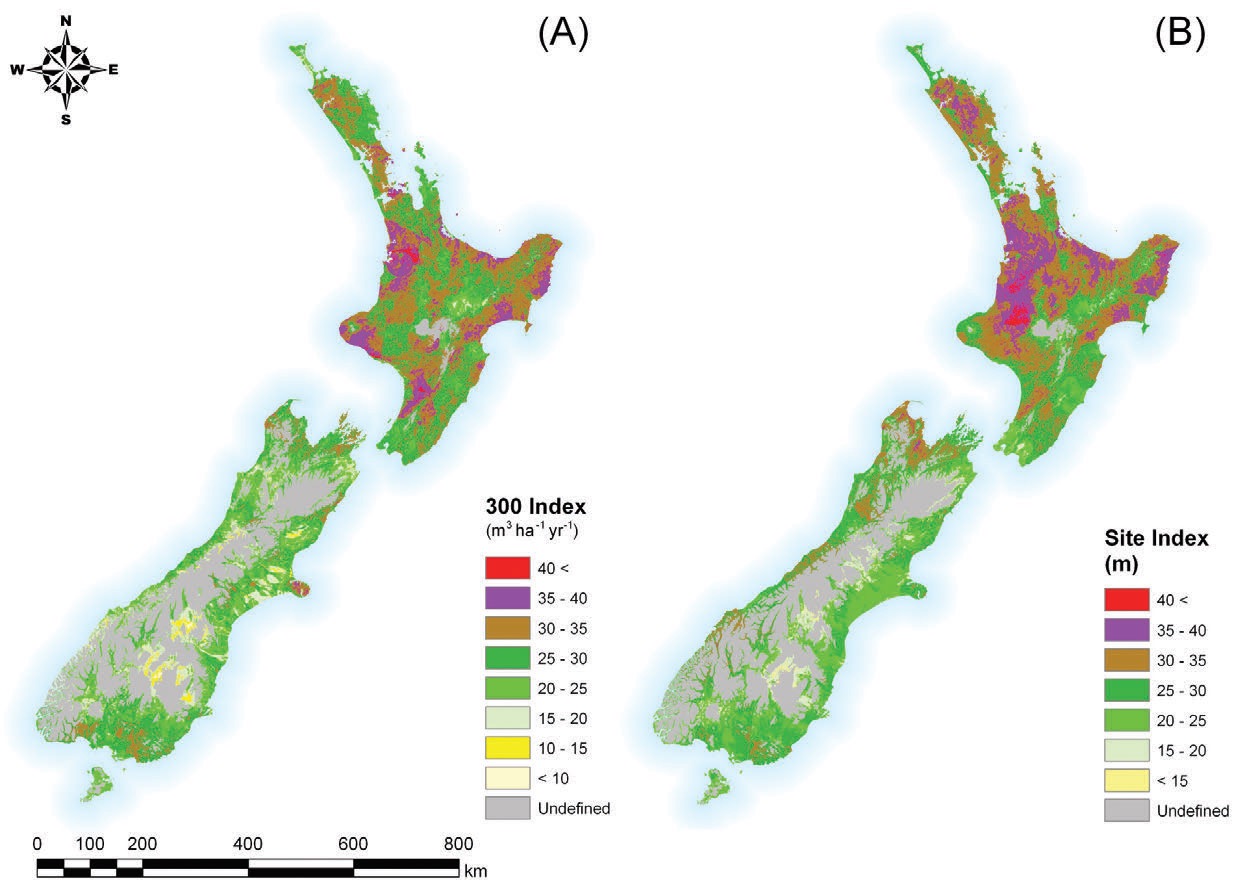
National forest productivity maps
The predicted 300 Index and Site Index conformed to previously known maps as well as expert knowledge provided by foresters. Both indexes were mainly related to air temperature and soil water balance. As a result, predictions increased from the cooler temperate Southland region to optimum values found at mid-latitudes in the North Island before declining further north. Increases in productivity also occurred in regions with high average root-zone water storage such as in Southland, and were reduced in drier areas such as the Canterbury Plains.
| 300 Index cubic metres | Site Index metres | ||||||
|---|---|---|---|---|---|---|---|
| Region | Hectares | Average | Range | Average | Range | ||
| Low | High | Low | High | ||||
| Auckland | 48,382 | 27.4 | 17.3 | 44.1 | 30.9 | 18.9 | 38.5 |
| Bay of Plenty | 268,848 | 27.2 | 14.3 | 41.9 | 31.9 | 16.1 | 41.0 |
| Canterbury | 96,984 | 22.2 | 8.2 | 38.7 | 24.1 | 13.5 | 33.8 |
| Gisborne | 151,505 | 32.2 | 20.4 | 44.4 | 33.2 | 15.6 | 42.6 |
| Hawkes Bay | 145,875 | 31.3 | 13.5 | 41.9 | 30.9 | 15.7 | 38.6 |
| Manawatu/Wanganui | 134,154 | 28.3 | 14.1 | 45.5 | 30.3 | 13.5 | 46.3 |
| Marlborough | 70,570 | 26.8 | 10.8 | 36.6 | 28.6 | 13.5 | 34.3 |
| Nelson | 10,543 | 26.3 | 17.1 | 33.0 | 29.6 | 20.7 | 35.5 |
| Northland | 176,737 | 26.8 | 13.9 | 38.9 | 31.7 | 19.6 | 40.4 |
| Otago | 105,503 | 23.6 | 6.9 | 34.4 | 24.7 | 13.5 | 33.1 |
| Southland | 60,578 | 25.6 | 12.0 | 34.7 | 25.5 | 13.5 | 33.2 |
| Taranaki | 25,519 | 31.2 | 17.9 | 42.6 | 32.5 | 19.6 | 39.9 |
| Tasman | 97,123 | 25.8 | 14.2 | 37.0 | 31.3 | 13.5 | 38.2 |
| Waikato | 327,740 | 27.5 | 15.8 | 47.2 | 32.6 | 19.1 | 43.0 |
| Wellington | 67,382 | 27.6 | 16.1 | 40.1 | 27.2 | 15.0 | 35.8 |
| West Coast | 41,617 | 23.3 | 7.7 | 33.8 | 28.2 | 16.7 | 35.3 |
| New Zealand | 1,829,060 | 27.4 | 6.9 | 47.2 | 30.4 | 13.5 | 46.3 |
There was wide variation in regional averages for productivity across the New Zealand plantation estate. For the 300 Index, predicted plantation productivity was highest at around 32 in Gisborne, Hawkes Bay and Taranaki. Lower producing regions in the low 20s were Otago, West Coast and Canterbury. Predicted plantation Site Index was highest in Gisborne, Waikato and Taranaki and lowest in Southland, Otago and Canterbury. The full figures are shown in the table.
By incorporating national climate, soil, terrain and observed forest productivity data within a geographic information system framework we have been able to develop a system that should be very useful for regional planning activities. The new ability to predict productivity at sites where currently no trees are planted is a significant benefit.
Limitations
There are limitations. Areas that have many permanent sample plots, such as the large central North Island plantations and Nelson, have a higher accuracy for predicting 300 Index and Site Index. Areas that were measured less intensely, or that have very large changes in micro-climates within a small area, will be prone to lower accuracy. Nevertheless both the underlying models and the maps developed provide a significant step forward in the understanding and assessment of forest productivity.
The main users of this technology will be land owners, forestry companies and investors wanting to locate new production, carbon and bioenergy forests. This mapping tool is not yet available for the general public but interested foresters have already begun knocking on the door of the Scion researchers.
Value for carbon forestry
One example of use is the recent location of potential new highly productive plantation sites for an international investment company interested in carbon forestry. Using GIS mapping we located the sites of interest and calculated both the indexes for each location. The areas they were looking to plant were about 200 hectares, but it is possible to choose an area as small as a single paddock or an entire large plantation.
The managers indicated a stocking rate of 800 stems a hectare and described the pruning regime. Using another tool, the C Change tool, also developed by Scion, we were able to calculate carbon equivalents per hectare for several different sites.
In the next few weeks these productivity maps will be made available to all Future Forests Research members both online and via CD for their own use. No doubt many will be keen to predict results for their own plot of land. There are no immediate plans for wider public release at this stage. Similar maps have been developed for lusitanica and coastal redwood species.
What is next?
We are looking at ways to make this type of information easily accessible. A prototype web-based tool exists. A recent Scion project with Dr Joao Palma in Portugal has taken the model and developed an interface to make the results web accessible using Google maps. At the website http://tinyurl. com/yfvqmea you can move the pointer around the map of New Zealand and get an estimate of radiata pine productivity and carbon storage.
As temperature and rainfall are components of the model, we will be able to explore what will happen to productivity as the climate changes. A first example of this function can also be seen on the web tool. Research will continue in this area to include the effects of changes in rainfall on productivity and also to include other species and ecosystem services such as reduction in erosion after afforestation. Emphasis will move to species other than radiata as we develop the methodologies and approaches.