Improving forest inventory for the woodlot owner
Chris Goulding and Marika Fritzsche, New Zealand Tree Grower May 2010.

Forestry is unusual compared with other crops in that planning should be carried out over the long term. The boom in new planting in the 1990's was carried out mainly by the non-corporate land owner, and while not urgent, such an owner should now begin to think about planning harvesting. Many other owners will be thinking the same thing and large volumes could be for sale in seven or eight years time, a buyer’s market.
Perhaps an owner’s planting was in the early 1990's. The trees may have been growing well and their harvest could be brought forward before the years where there will be a harvest glut? Or perhaps, conversely, the trees would benefit from being left longer? This would allow the majority of logs to exceed the small end diameter limits of the most valuable grades, and the harvest scheduled for after the period when each age class that exceeds 80,000 hectares is likely to be harvested?
The first thing that owners require is information about what is available to sell – a pre-harvest forest inventory. With a good inventory, the data can be projected forward in time to predict the volumes by log grade available for several potential felling dates.
Importantly, this data provides information to the owner as to whether an offer for purchase is fair. In the corporate forests, the stands are large and inventories have sufficient inventory sample plots to make an estimate with an acceptable level of uncertainty or degree of precision. The expected volumes of the more common log-grades are likely to be within plus or minus 10 per cent of the estimate.
However, the private woodlot is often small in area but every bit as variable, if not more so, than larger stands. This will require the same number of inventory plots to obtain similar levels of precision. A large stand that has been professionally managed throughout its life might have a sampling intensity of one plot for every one or two hectares, but the woodlot will require three or four plots per hectare. Many consultants balk at this intensity of effort, arguing that the owner will not pay and the information is not worth the cost.
It was for this reason that Scion began working with CSIRO (Australia) to conduct and apply research into image processing. This was to count trees that, combined with on- the-ground sampling methods, could reduce costs especially for the woodlot owner. Researchers devised a suitable single tree sampling system as an alternative to more conventional area-based plots. This research has been continued under the auspices of Future Forests Research Limited.
Sampling trees
If a reasonably accurate total tree count could be obtained from readily available remotely sensed imagery, an estimate of the volumes in a block to be harvested could be obtained. This is calculated by multiplying the total tree count by the average calculated from a measured sample of trees. Sampling individual trees could avoid the between-plot, per hectare variation across the stand and just enough trees measured to account for the between-tree variability. Potentially, fewer trees need be measured than with plot based inventory for the same degree of precision. The proposed method would work best relative to conventional plots when the individual trees look similar in form and quality, but when the stocking varies across the woodlot. In small stands with irregular boundaries, as is often the case with farm woodlots, the need for an accurate estimate of net stocked area could be avoided.
Image processing for tree identification
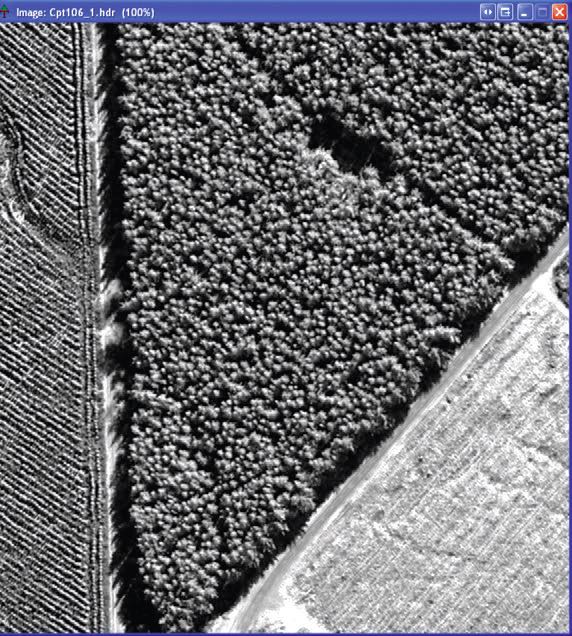
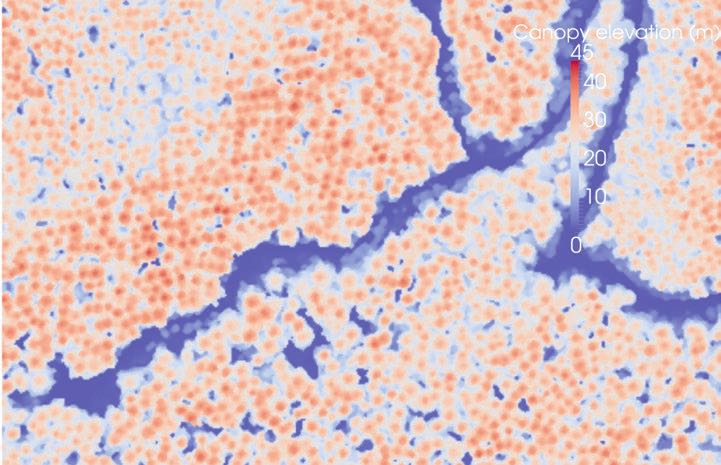
Image processing to determine tree locations and a count of trees has developed over the last decade to the point where there are several methods that a forest owner or consultant could use. This assumes that remote sensed imagery is available at a low cost. The imagery could be obtained from satellites, from aerial photography, or from LiDAR (light detection and ranging), a rapidly emerging technology when applied in forestry. Satellite imagery from the QuickBird high resolution sensor, often used in Google Earth, has been tested in a study area in Kaingaroa forest. Aerial photography has also been used with good results. In the research trials the photographs were supplied by forestry companies from their regular photography used for mapping. Acceptable photographs could also be obtained from existing imagery at regional councils, sometimes at nominal cost.
Not yet fully automated
TIMBRS is a semi-automated implementation of the tree identification and delineation calculation, originally developed for eucalypt forests. The resolution of imagery required for accurate tree counts depends on the type of forest and its age class.
Satellite imagery from the QuickBird sensor was available for the study area. The imagery has approximately 2.4 metre resolution in its bands of blue, green, red and near-infrared, and 0.6 metre resolution in a single panchromatic band.
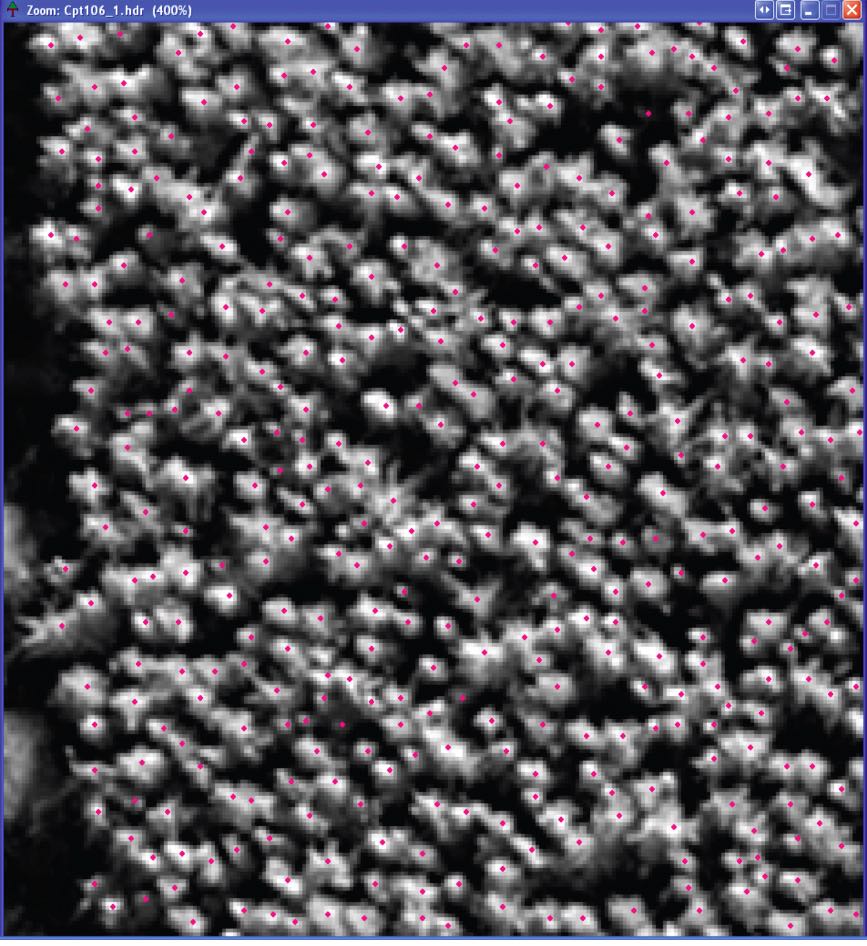
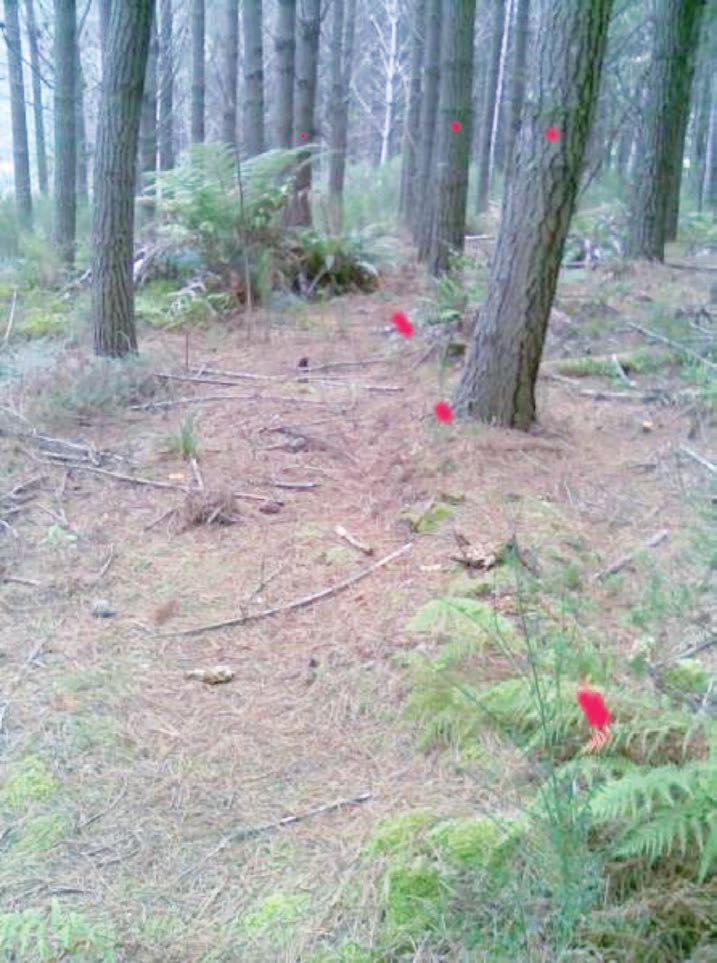
Fully automated tree location and counting without any user being involved may be highly desirable, but this cannot yet be achieved with any degree of confidence. Seen from above, radiata pine crowns are unruly sometimes with multiple leaders, irregularly shaped crowns, broken tops and suppressed trees. In TIMBRS, dots are use to represent the computer identified trees, then modifications can be made to the programme to produce another estimate, until the tree selection looks right.
With some practice an operator familiar with the software could produce an acceptable result within an hour. Tests involving physically counting all the trees in several small blocks and comparing the numbers have shown that it is possible to estimate stocking to within five per cent.
Individual tree sampling
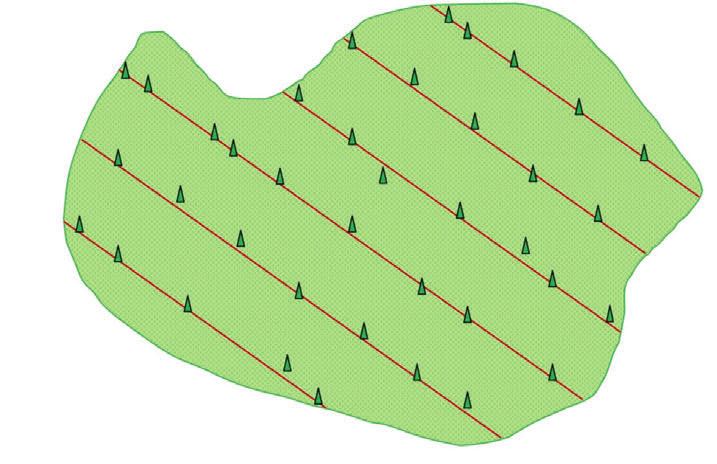
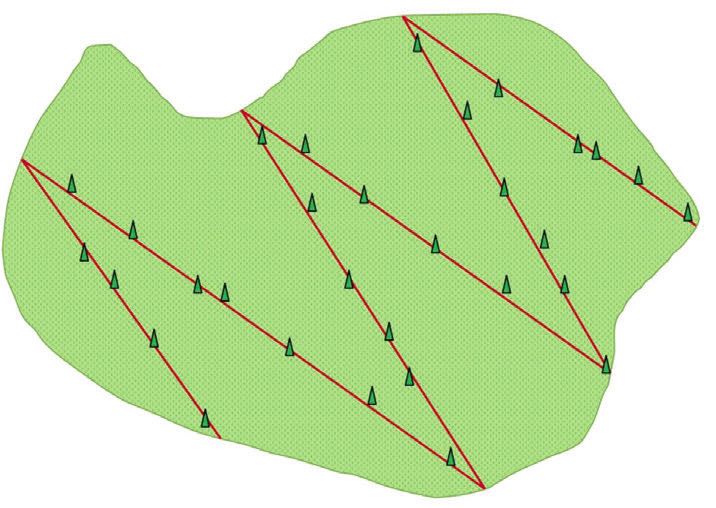
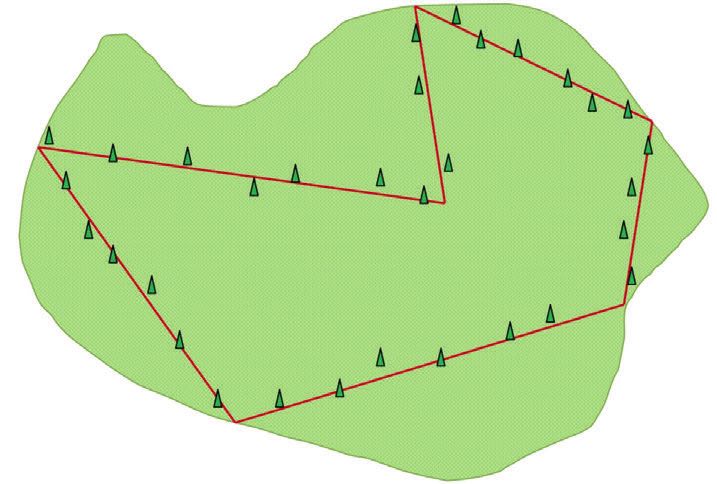
In practice, selecting individual trees in an efficient manner so that they are a valid random sample is not simple. A field method is required that is practical, could be used by commercial field crews and is auditable. Three methods have been suggested − parallel sample lines, z-lines and a pre-planned walk. Each involves selecting trees in a narrow swath, measuring every second or third tree for diameter at breast height, and every second or third of these measured more intensively for stem quality and log grades. The aim is to measure at least 50 trees for merchantable volume with a further 50 for diameter at breast height.
Walking and sampling
The z-lines method is useful when it is difficult to walk along the stand edges due to heavy vegetation. It increases the chance of selecting trees at the apex of the lines, but this disadvantage is not a problem.
The professional, pre-planned walk is best used by an experienced professional as clearly there is the potential for selecting trees in a biased fashion. The data can be analysed by inventory software, with the accuracy interpreted with caution for the pre-planned walk, but as a guide as to the likely range within which the true mean might lie.
For the small woodlot, measuring a sample of individual trees is far preferable than a small, inadequate-sized, sample of bounded plots. This may be all that the forestry advisor could afford to carry out for their client.
Advances in the image processing techniques for forests are occurring at a rapid pace. In Europe, a commercial service is being offered to provide a tree count and a map of the tree locations. In New Zealand, LiDAR is starting up for forestry applications and promises to produce better tree counting results than photographs.
It will also provide good estimates of individual tree heights. It is already being used by MfE to supplement a nationwide network of ground permanent sample plots and measure carbon in New Zealand’s production forests.