
This is free.
New multi-species calculator
Mark Kimberley and Michael Watt, New Zealand Tree Grower February 2024.

A new multi-species calculator has been developed to help a tree grower make decisions. The calculator predicts growth for even-aged plantations of eleven different species. It also provides annual estimates of carbon sequestration, basal area, mean top height, stem volume, stocking and wood density as well as predicting harvest and log grades. These predictions provide growers with a full suite of information for different species and silvicultural regimes for their site or region.
The calculator is not suited to people entirely new to tree planting, because it requires some knowledge of planting and tending different species. If you are uncertain about stocking rates, rotation lengths, and pruning and thinning regimes, first have a look at to the species information on the NZFFA website or the guide ‘Growing alternative exotic species’ available on the Forest Growers Research website.
Eleven species are available within the calculator –
- Blackwood Acacia melanoxylon
- Coast redwood Sequoia sempervirens
- Cypress Cupressus lusitanica
- Cypress Cupressus macrocarpa
- Douglas-fir Pseudotsuga menziesii
- Eucalyptus delegatensis
- Eucalyptus fastigata
- Eucalyptus nitens
- Eucalyptus regnans
- Eucalyptus saligna
- Radiata pine Pinus radiata
The growth models
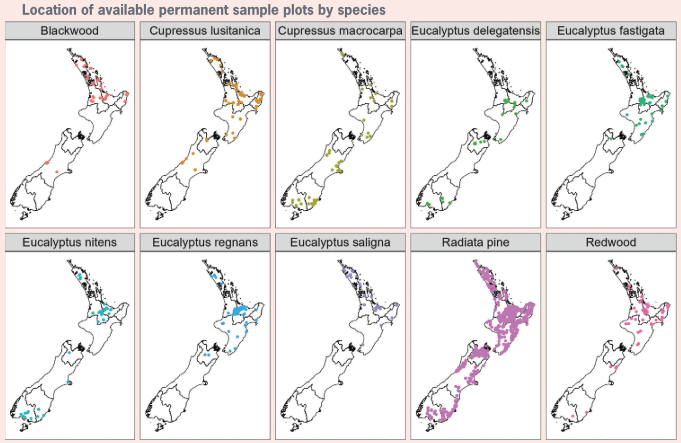
The growth models were developed using permanent sample plot measurements. Models previously developed by Scion are used for radiata pine and Douglas-fir, while newly developed models are for the remaining species. Species choice for the calculator was determined by the number and quality of permanent sample plots available for any given species. If you do not see your favourite species in the list, it is because good representative growth data probably does not exist.The first maps show where the plots used for creating the growth model of each species are located throughout New Zealand.
Permanent sample plots
Good permanent sample plot data is crucial to the development of growth models, and it is worth reiterating the value of this long-term data which can only be obtained by regularly measuring. Scion’s recommendation for permanent sample plots is that they should measured –
- Once a year until the trees are 11 years old
- Once every three years between 11 and 16 years
- Once every five years when over 16 years.
The NZFFA Action Groups have supported work to re-measure plots in alternative species over the past two to three years, with many established sometimes decades ago by earlier researchers. New plots have been established where there are gaps by species or region.
The work has been led by Vaughan Kearns and funded as part of projects managed by Forest Growers Research.
Site index and 300 index
Permanent sample plot data has been used to develop the two productivity indices used in the calculator – the 300 Index and the Site index. Both are important parts of the forest growth models.The indices are widely used by the forest industry to describe a site’s growth potential for radiata pine, but they are also available for the other species where sufficient data is available.
The 300 Index is the mean annual volume increment in cubic metres per hectare each year of a stand which has been thinned at an early age to achieve 300 stems a hectare at age 30.The Douglas-fir model uses the 500 Index, with trees thinned to 500 stems a hectare.
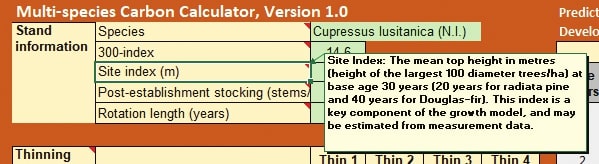
The Site Index is the mean top height in metres. It is the average height of the 100 largest diameter trees per hectare at a base age of 30 years, or 20 years for radiata pine and 40 years for Douglas-fir.
Both the 300 Index and Site index are required when using the calculator and they can be determined using three methods –
- For existing stands which have been measured, plot data can be entered into the calculator and the two indices can be obtained from these measurements.
- In situations where new planting is planned, the two indices can be approximated using regional averages from the calculator’s help file. For some species, such as blackwood and some of the eucalypts, permanent sample plot distribution is geographically limited.
- In this case average data for the North Island or South Island can be selected and used for a site’s productivity potential for that species
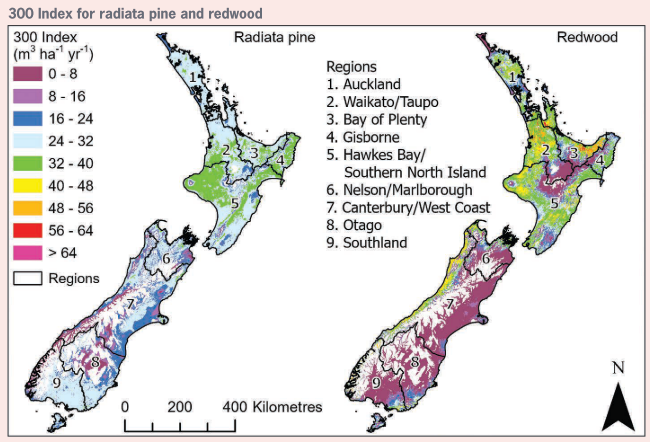
- For those with GIS capability, the productivity indices for several species for a site can be obtained from high resolution maps. These are available at https://koordinates.com which can be freely downloaded after a simple sign up to the website is completed.
The high-resolution maps show the growth potential for the different species in different regions and even down to local small forest areas.The maps below show the comparative 300 Index of radiata pine and redwood across the country using maps downloaded from the website.
Using the calculator
The calculator is available to be downloaded from the Forest Growers Research website. A help file is also available and it is a good idea to have this to hand to ensure any early queries or uncertainties are resolved quickly and you can begin to run different scenarios for whatever species and regimes you are interested in. First- time users need to enable the calculator by ensuring it is a ‘trusted file’ on their own computer, allowing it to make changes.
For users who have used other spreadsheet-based calculators, the new multi-species calculator has a familiar appearance.You are asked to select a species from a drop-down box, enter site productivity indices and then can adjust stocking, pruning and thinning regimes to suit.
Each input box has a description which is revealed by clicking on the red comment triangle – this information is helpful in explaining the meaning of each input.
There are a few other choices which the user has to make before the ‘run model’ button is clicked – these are all explained in the help file with standard default options available.
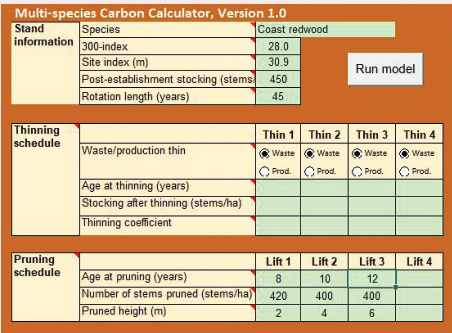
Examples for a model in a simple no-thin, three pruning-lift redwood regime are shown below. It shows a redwood regime, planted at 500 stems a hectare with early losses of 50 stems a hectare, with no thinning and three pruning lifts.
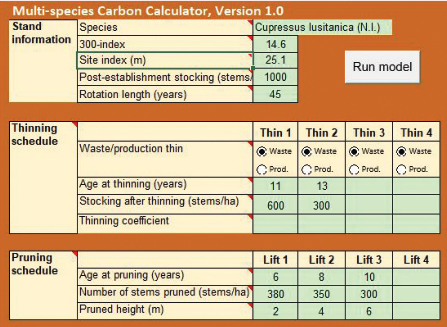
The illustration below shows an example North Island C. lusitanica with two waste-thinning operations and three pruning lifts.They were planted at 1,100 stems a hectare with early losses of 100 stems a hectare.
Users can adjust the information they add virtually indefinitely.This gives you the to look at different stocking rates, pruning and thinning options and see their effect on potential harvest out-turn and carbon figures.
Calculator results
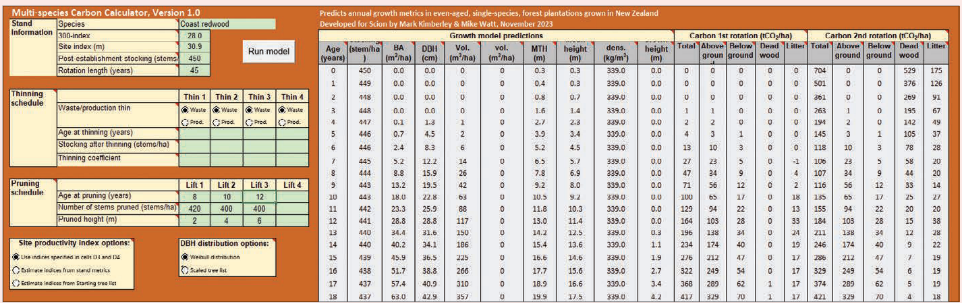
Once input entries have been completed, the button to run the model can be clicked and you should see the updates growth model predictions and carbon data on the same screen almost immediately.
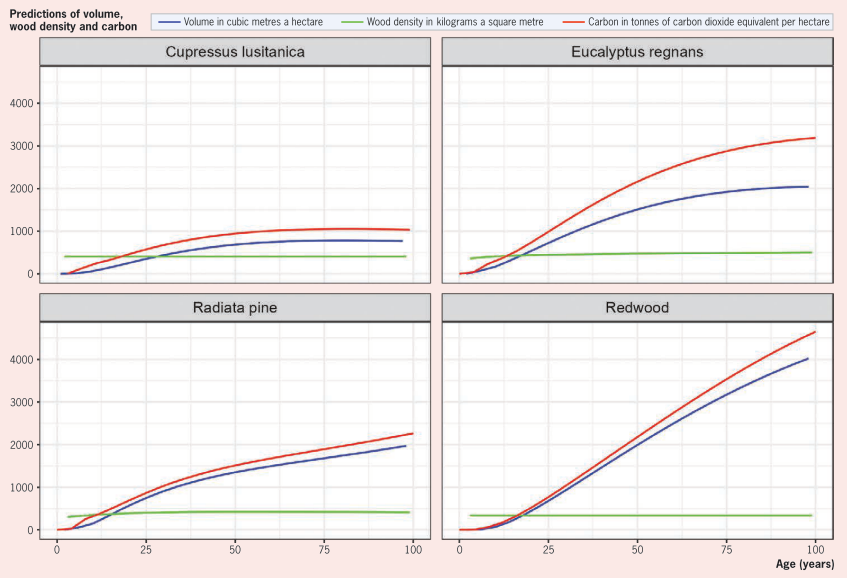
A series of comparative graphs to illustrate the difference in volume and carbon productivity between all 11 species is available in the help file. An example of four species is reproduced in the graphs below. Anyone who is used to using excel data could produce similar graphs for their own options.
The graphs show predictions of total volume in the blue line, wood density with the green line and total carbon with the red line against age and by species.
Model predictions were extracted from the calculator using average North Island productivity indices.The values of volume and carbon were reduced by 15 per cent to account for stand gaps.
The multi-species calculator does not provide any financial analyses. However, if you are interested in indicative costs of current planting or harvesting operations you can use a second freely available method involving TreeFarmer.
TreeFarmer
TreeFarmer is also available on the Forest Growers Research website. It is designed to for small forest planning or harvesting decisions and you may have read the article about it in a previous Tree Grower. It enables users to develop map-based options of new planting
or harvesting for their specific location and provides indicative cost estimates.
The new version gives you the option of eight different species including updates for redwood, C. lusitanica and C. macrocarpa from the new multi-species calculator. A site productivity map for each species has been incorporated to give wood yields at a paddock level.
TreeFarmer has some generic prune and thin options for those wanting to manage trees for clearwood, rather than the multiple combinations of silvicultural regimes offered by the multi-species calculator. In the latest version log grades have been incorporated to allow users to calculate the nett return after harvest.
Durable eucalypts
Durable eucalypts are not included as a planting option in the multi-species calculator.This is unfortunate given the growing popularity of this emerging species group in new planting schemes but is because of the lack of older planting and permanent sample plot data from older trees.The NZ Dryland Forests Innovation have over 40 durable eucalypt trial sites in their target regions and have established around 700 permanent sample plots.These are measured regularly and are producing valuable early growth data.
Professor Euan Mason and colleagues at the University of Canterbury School of Forestry are already working on the durable eucalypt growth model gap. Euan Mason is building on earlier work by Dr Serajis Selakin and has produced a growth, timber volume and carbon model for E. globoidea. A similar model for E. bosistoana is not far away.
Helping with decisions
The new multi-species provides a quick and easy way of comparing the results of growing different species and applying different silvicultural regimes in specified regions or locations. Species of interest to owners of small forests – radiata pine, cypress, redwoods and non-durable eucalypts – are all included. None of the methods available are a substitute for site-specific knowledge and local experience, but they can be used to help make decisions and enable informed discussions with forestry consultants.
Mark Kimberley, is a statistician and forest plantation growth modelling specialist and Dr Michael Watt, Principal Scientist and remote sensing and GIS specialist at Scion.