A comparison of the 2019 Pigeon Valley forest fire with similar events in the past
Murray Dudfield, Geoff Cameron, Jim Carle, Kerry Ellem and Peter Hill, New Zealand Tree Grower February 2020.
The February 2019 Nelson Pigeon Valley wildfire has been claimed by some as the most destructive plantation fire in the past 60 years. This article reviews data from other wildfires to show the fire environment in the first five days does not warrant this characterisation.
The first day of the Pigeon Valley fire involved weather conditions which had potential for spot fires − those ignited outside the perimeter of the main fire by flying sparks or embers. Observations made on the first day confirmed that spot fires did occur as the fire spread northwards towards Eves Valley. Containment was achieved after the fire left the plantation forest lands and spread into lifestyle blocks.
In subsequent days the fire environment, fortunately for other potentially affected neighbouring land owners, was not conducive to spot fires. The weather conditions on those days suggests that −
- The need for the construction of firebreaks external to the eastern edge of the forested lands requires examination
- The need to evacuate communities within two kilometres of the south-eastern side of the forested lands also requires examination.
Based on the forecast, and the actual weather during the first week of this wildfire, this article raises the questions −
- Was full consideration given to the actual and forecasted weather information along with the fire weather indices during the first few days of this fire?
- Did this support the decisions to construct firebreaks, external to the plantation, and the evacuation of people from communities, to the south east of this wildfire?
The article also re-examines the forecast and the actual weather information to establish what the fire weather environment was over the days following the start of this wildfire. On the basis of this data, it also determines whether the fire had the potential to spread into open land, external to the plantation lands on the south-eastern edge, during the days following the first 18-hour period of the fire.
Wildfire behaviour
While the causes of wildfires vary and the results are always unique, all wildfires can be characterised in terms of their physical properties, their fuel type and the effect that weather has on the fire. Fire behaviour, and severity, result from the combination of factors such as available fuels, topography and weather.
The spread of vegetation fires varies based on the flammable material present, its vertical arrangement and moisture content, and weather conditions. Wildfires occur when all the necessary elements of a fire triangle come together in a susceptible area − an ignition source is brought into contact with a combustible material such as vegetation which is subjected to enough heat and has an adequate supply of oxygen from the ambient air.
Subject to fuels being dry enough to sustain a fire, the main influences on how vegetation fires move through the landscape are humidity, topography, wind and temperature. The slope of the landscape is also important. Fires burn much faster uphill than down because the radiation and convection a fire creates pre-heats the unburned fuel ahead of the flame front. This is more effective up a slope than down. A 10-degree increase in slope usually results in a doubling of the speed of the fire. Fire will spread up a 20-degree slope four times as fast as it will along flat ground.
Wind speed
Wind speed is the environmental variable that has the most significant effect on the spread of fires. With wind speeds below 10 kilometres an hour, a fire will usually burn slowly without a definite spread direction. However, as winds increase in strength, the rate of fire spread increases. A change in wind direction, often from a cold front, can activate the side of a long and relatively narrow fire, turning it into a very broad flame front. In general, a wider fire will burn faster than a very narrow one.
The heat of a fire can create whirlwinds and turbulent air currents. Wind is also a major factor in transporting firebrands − pieces of burning fuel, such as twigs, leaves or small embers − ahead of the main fire. This causes spotting with ignition of new fires ahead of the fire front.
Relative humidity
Humidity also plays a big part in fire behaviour as the lower the relative humidity, the more vigorously fuels may burn. When the relative humidity is 100 per cent, the air is holding as much water vapour as it can. More than likely, however, the water vapour is condensing on to dust or other particles which reveals itself as fog. In comparison, zero per cent humidity would indicate the complete absence of water vapour, although that does not occur in nature.
Preferred relative humidity levels for managing prescribed burns – planned fires or controlled burns − should ideally be between 30 and 55 per cent. Under special conditions, a wider range of relative humidity, as low as 20 per cent and as high as 60 per cent, can result in successful burns.
When relative humidity falls below 30 per cent, prescribed burning becomes dangerous. Fires are more intense under these conditions, fire behaviour is unpredictable and spotting is much more likely. On the other hand, when relative humidity is 60 per cent or higher, a fire may leave unburned islands or may not burn hot enough to accomplish the desired result.
Spotting ignition is one of the three significant mechanisms of wildfire spread. It can be considered as a discontinuous fire spread mechanism which is synonymous with solid mass transport. The transport of burning fire embers outside the fire perimeter is a serious concern to firefighters because it affects fire behaviour and difficulty of control, and poses a serious safety threat.
Research undertaken in Portugal in 2018 involved monitoring and documenting selected wildfires, noting the appearance or absence of spot fires during the prevailing conditions at the time. This work showed that, on a database of 166 field observations, no spotting ignitions were recorded at relative humidity values higher than 46 per cent. Massive spotting which triggered extreme fire was documented for values lower than 17 per cent.
Research undertaken by John Weir, superintendent of the Oklahoma State University Research Range, showed that from 99 prescribed burns, his conclusions were that for the 40 per cent relative humidity threshold, the probability of a spot fire was 41 per cent when relative humidity was below the threshold and only 3.8 percent when it was above the threshold − a substantial difference.
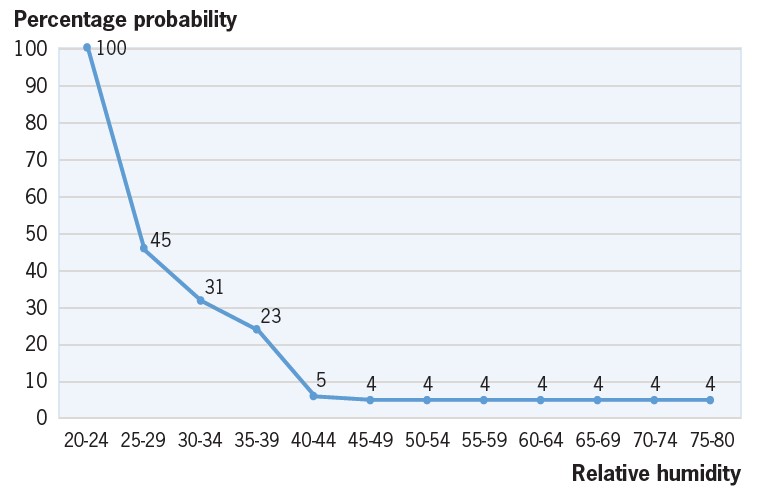
The data also showed that, below the 40 per cent threshold, spot fire probability rose with each five per cent drop in relative humidity. At 25 per cent relative humidity, there appears to be another threshold. Below this point, there was a 100 per cent probability of a spot fire occurring. But in the 25 to 29 per cent relative humidity range, spot fire probability dropped from 100 percent to just 46 per cent. In the 30 to 35 per cent range, only one out of three burns were likely to produce a spot fire.
Crossover
A formal definition of crossover is listed by the Canadian Forest Fire Centre as ‘the point at which the numerical value of the ambient relative humidity is less than, or equal to, the numerical value of the ambient air temperature’. This may be used as a rule of thumb indicator of extreme burning conditions. It is a rule of thumb primarily used by fire suppression staff. However, some researchers have been cautious of the crossover rule of thumb saying that it has some value but may be over-used and misinterpreted.
One of the problems is the tendency of fire managers to prepare for severe fire circumstances only when crossover conditions occur. However, severe vegetation fires can occur in the absence of crossover. Obviously, fires may show extreme behaviour because of other factors, including wind speed, temperature, relative humidity, steepness of the slope, and dryness of medium and heavy fuels.
In the interactive training course titled Wildland Fire-Safety on the Fireline, ‘Crossover can be a useful reminder that the potential for blow-up or extreme fire behaviour exists. However, do not rely on crossover as your only indicator of such situations. Forecasters must be mindful that there is more to extreme fire behaviour potential than just crossover or wind speeds greater than 30 kilometres per hour. Crown fire behaviour can occur in the absence of crossover conditions and with only moderate wind speeds, about 15 km an hour, if other criteria are met, such as dry medium or heavy fuels or steep slopes’.
Predicting fire behaviour
Fire intensity is one of the major determinants associated with the difficulty of controlling or containing a free-burning vegetation fire. From a fire behaviour standpoint, the other factors include the rate of perimeter increase or growth, which is a function of the rates of spread at the head, flanks and back of the fire, spotting characteristics which is partly related to fire intensity and development of fire whirls.
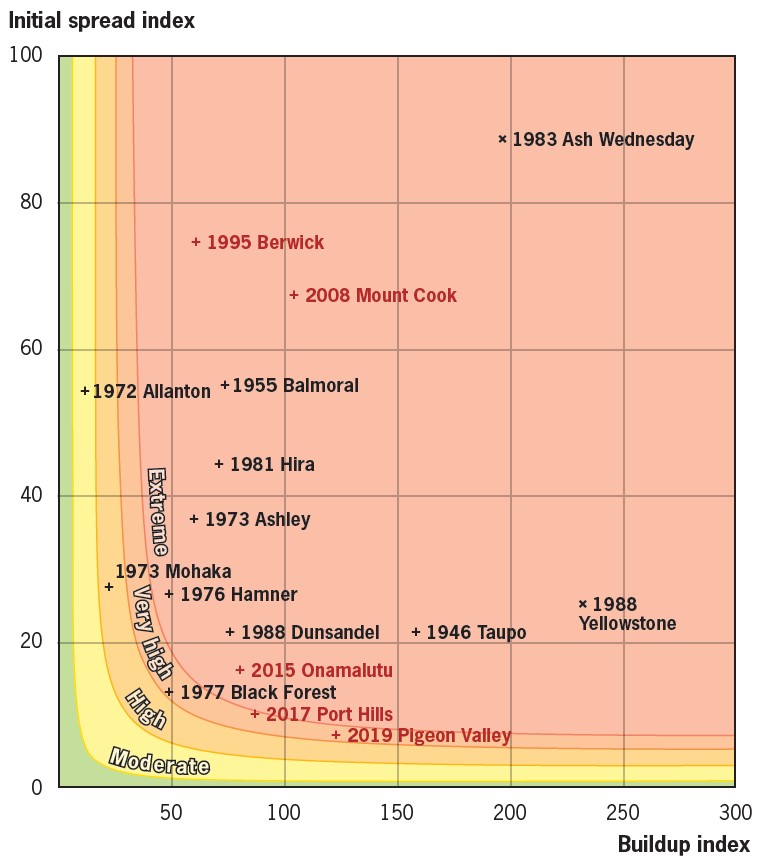
A further reference, with regards to the Pigeon Valley wildfire environment and fire behaviour, is a 1994 report prepared by Marty Alexander, a Canadian forest fire scientist who helped re-establish our forest fire research programme, and revised the fire danger class criteria for New Zealand’s forest and rural areas. This report refers to the Canadian forest fire behaviour prediction system which allows for the quantitative prediction of fire behaviour including fire intensity using, among other inputs, the initial spread index and build up index components of the fire weather index system. Fire spread rates are based on the fine fuel moisture code wind speed, slope steepness and fuel type.
Alexander then assumed that as the initial spread index represents only a few days of weather history after rain, the build-up index, which represents the increasing amount of fuel available for combustion as a dry spell lengthens, is therefore presumed to have at least some effect on the rate of fire spread as well. Using the Alexander findings and applying this to the Pigeon Valley on each of the seven days, beginning 5 February 2019, it provides the results of fire spread in forested lands as shown in the table.
| Date | Build-up index | Initial spread index | Estimated forward rate of spread metres an hour |
|---|---|---|---|
| 5 February | 125 | 11.6 | 400 |
| 6 February | 126 | 2.9 | 10 |
| 7 February | 129 | 4.7 | 70 |
| 8 February | 131 | 4.9 | 75 |
| 9 February | 133 | 4.2 | 70 |
| 10 February | 135 | 5.4 | 90 |
| 11 February | 138 | 5.9 | 100 |
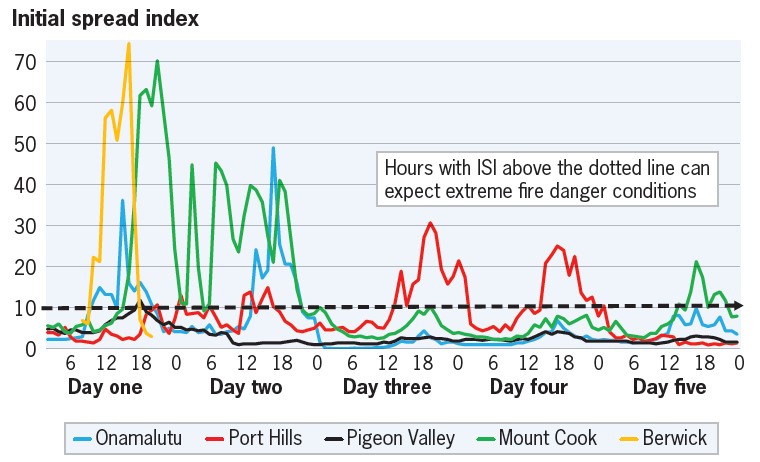
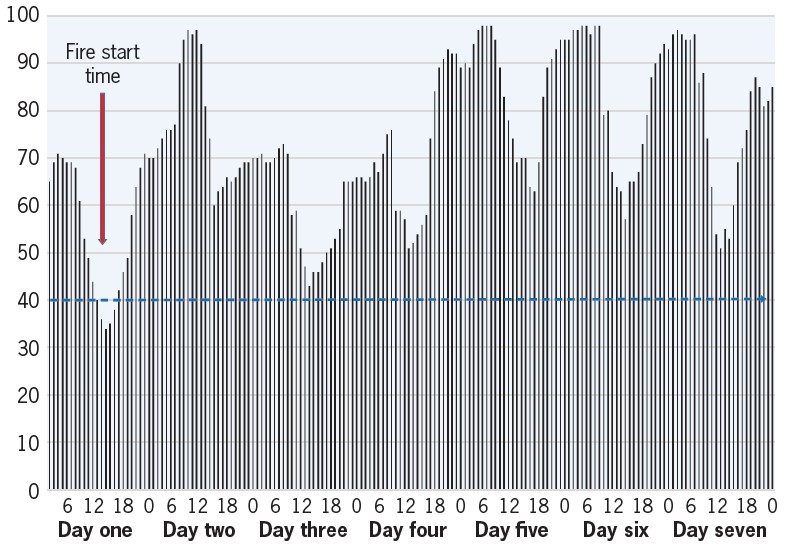
The graph above outlines the fire intensity for the Pigeon Valley wildfire and how it compares with the Onamalutu, Port Hills, Mount Cook and Berwick forest fires. This shows the points of difference over a five-day period for each wildfire. The Pigeon Valley fire danger conditions following the first day were low to moderate.
New Zealand plantation wildfire case studies
From a number of plantation wildfires over the past 30 years, a fire environment comparison between five fires which burned areas of plantation greater than 100 hectares, makes for an interesting appraisal. The forest fires were −
- Berwick forest fire on 26 February 1995
- Mount Cook forest fire on 16 January 2008
- Onamalutu forest fire on 4 February 2015
- Port Hills fire on 13 February 2017
- Pigeon Valley forest fire on 5 February 2019.
Berwick forest fire
The Berwick forest is located 36 kilometres south west of Dunedin, located not far from Waipori Falls. The
26 February 1995 Berwick forest fire burned a total area of 255 hectares, including 181 hectares of stocked plantation forest, and 74 hectares of scrub and recent cut-over. This fire showed extreme and uncontrollable fire behaviour, with frontal spread being halted only when the fire reached pastoral lands.
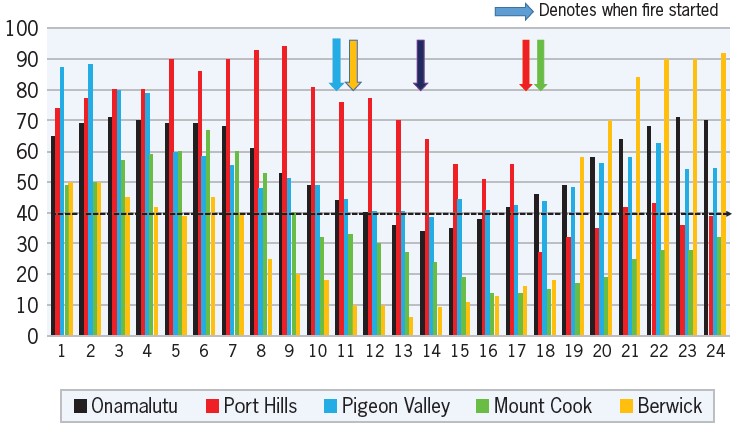
The graph above shows that fire danger, from a relative humidity perspective, were as bad or worse than those encountered in many other New Zealand and overseas wildfires. Spread rates of the major fire runs were 850 to 2,780 metres an hour, and fire intensities ranged between 12,750 and 41,650 kilowatts per metre. Changes in wind direction, fuel types and terrain significantly altered the fire behaviour, making suppression difficult and dangerous.
Extreme burning conditions prevailed from 11.00 to 18.30 on the first day. Within six hours a theoretical free burning fire on flat ground, in continuous plantation of mature and mix-rotation conifer, would be expected to spread more than 17 km, have a perimeter length exceeding 30 km, and burn an area greater than 4,500 hectares. The Berwick fire burned a much smaller forest area, just 255 hectares, and this is entirely due to the head fire running out of continuous forest fuel when it reached pastoral lands.
On the first day for a period of 10 hours from 09.00 to 18.00, the fire environment experienced crossover effects where the relative humidity values were lower than the temperature values. For the two-hour period from 13.00 to 15.00, the relative humidity was less than 10 per cent. With the lack of water vapour in the atmosphere this provided a very dry environment which produced extreme fire involving spot fires. Wind speeds from varied between 24 and 33 kilometres an hour. These conditions are the most extreme of any recorded for a plantation wildfire in New Zealand.
Mount Cook forest fire
On the afternoon of Wednesday 16 January 2008, a fire was ignited on farmland on the eastern side of Lake Pukaki in South Canterbury. This fire escaped initial attempts at containment and went on to burn an area of 756 hectares of mainly forested lands. The fire burned actively for the first two days, during which were periods of extreme fire behaviour due to hot, dry windy conditions and heavy fuel loadings. The change in weather and fuel types allowed the fire to be contained on the third day.
On the first day, for a period of seven hours from 14.00 to 20.00 hours, the fire environment experienced crossover effects where the relative humidity was lower than the temperature. For six hours the relative humidity was less than 20 per cent providing for a dry environment. Wind strengths varied between 34 km and 43 kilometres an hour. During the second day there was also a second period of a crossover of temperature and relative humidity effects for four hours with relative humidity less than 20 per cent for three of those hours.
Onamalutu forest fire
The February 2015 Onamalutu Forest Fire burned almost 600 hectares, the biggest fire to affect the Marlborough region since the Boxing Day fires of 2000. It devastated forest and pastoral lands between the Onamalutu and Okaramio Valleys.
On the first day the fire environment experienced relative humidity values greater than 40 per cent. Wind strengths varied between 23 and 38 kilometres an hour. On the second day the fire environment became elevated. For a nine-hour period the relative humidity values were between 28 and 40 per cent. With these hourly levels, and the wind strength during this period between six and 43 kilometres an hour, this would have resulted in spotting fires. On the third day the fire environment was greatly reduced as the relative humidity only went below 40 per cent for a three hour period in the late afternoon with light winds. On the fourth day the relative humidity did not go below 43 per cent.
Port Hills fire
On Monday 13 February 2017, two fires broke out in the Port Hills area of Canterbury at Early Valley Road and Marleys Hill. The two Port Hills fires merged into one wildfire and covered an area of 1,660 hectares, with a perimeter of 61 kilometres, and resulted in the loss of nine dwellings with a further five suffering fire damage. The fire area also included 595 hectares of forested lands. The decision made on Monday night to manage the Early Valley Road and Marleys Hill fires as one incident, under one incident management team, was an appropriate one as both fires spread and eventually merged as one.
For the evening on the first day of the Port Hills fires the fire environment hourly temperatures were between 15 and 23°C, relative humidity of between 27 and 56 per cent and wind speed between 12 and 36 kilometres an hour. On the second day the fire environment remained in extreme conditions with a crossover of relative humidity and temperatures for an hour. In addition, for a 16-hour period entering the third day, relative humidity was less than 40 per cent. Within the period the relative humidity went below 30 per cent for 10 hours. Wind strengths over this three-day period involved nine hours of wind greater than 30 kilometres an hour. Given these conditions spot fires would have become a concern on the first three days of this fire.
Pigeon Valley forest fire
At approximately 14.00 hours on Tuesday 5 January 2019, a wildfire was reported in Pigeon Valley near Wakefield, about 30 kilometres south west of Nelson. Given the elevated fire danger at the time, this wildfire spread quickly from farmland into forested lands, covering more than 1,200 hectares by the end of the first day. This also included the destruction of one dwelling. The second day saw the fire continue to slowly spread covering a further 400 hectares. By day three the fire was finally contained to an area involving 2,300 hectares.
The majority of the area burned was planted forest. This forest is owned by a number of corporate and smaller private forest owners. The area involved a range of different aged forest from recently cut-over logging slash, newly planted trees with scrub understory, to intermediate and mature forest stands. A heavy commitment of aircraft resources, firefighters and overhead personnel was used to this fire. The final cost is estimated to be at least $17 million. Forest industry estimates for firefighting and evacuation costs have been as high a $50 million. This will be the highest cost incurred for any single wildfire in New Zealand history.
For the afternoon on the first day of the Pigeon Valley fire hourly weather information taken from the Dovedale remote automatic weather stations showed the hourly temperatures ranged between 10 and 24°C, relative humidity between 34 and 70 per cent, and wind speed between 10 and 24 kilometres an hour. On the second to the seventh day the relative humidity was no lower than 40 per cent, and temperatures no higher than 25°C.
At the Nelson airport remote automatic weather stations, 22 kilometres from the Pigeon Valley fire site, it recorded a comparable fire environment to Dovedale, with hourly temperatures which ranged between 18 and 30°C, relative humidity between 34 and 68 per cent, and wind speed between 11 and 26 kilometres an hour. On the third day of this fire the relative humidity was no lower than 45 per cent and temperatures no higher than 24°C. This produced a benign fire environment for the second day. At no time during the first two days was there a crossover period of relative humidity and temperatures at the Nelson Airport or Dovedale weather stations.
From the second to the seventh day the probability of spot fires was less than four per cent given the lowest daily relative humidity values and wind speed, which are outlined in the table at the top of the next page.
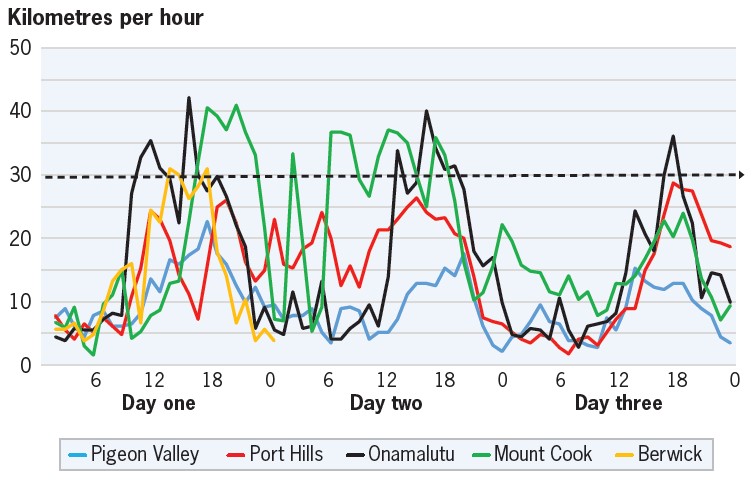
Given the points made above, the transportation of live embers beyond the fire ground boundary was highly unlikely over following six-day period. As further information the graph provides an overview of wind speed for each of the five forest fire for the first three days.
| 6 February | 7 February | 8 February | 9 February | 10 February | 11 February |
|---|---|---|---|---|---|
| Relative humidity 60 per cent | Relative humidity 43 per cent | Relative humidity 50 per cent | Relative humidity 58 per cent | Relative humidity 57 per cent | Relative humidity 48 per cent |
| Wind 18.7 kph | Wind 16.9 kph | Wind 18.7 kph | Wind 19.1 kph | Wind 21.2 kph | Wind 19.4 kph |
Examination
An analysis of the weather forecasts provided to the Pigeon Valley fire incident management team has shown a strong correlation with the actual weather which followed. When you compare the actual weather with the Berwick, Mount Cook, Onamalutu and Port Hills fires there are a number of interesting observations.
For the hourly recorded weather, the table below outlines the number of hours during the first two days for each of the forest fires. This compares the number of hours between each fire where the relative humidity and wind were at levels which would have provided a fire environment conducive to elevated fire behaviour and the potential for spotting fires.
The fire suppression cost per hectare for each of these fires is also provided. This shows a clear disproportional cost per hectare for the three fires in the past four years when compared with the Mount Cook and Berwick forest fires. Further work at some future point is required to identify why the cost per hectares is so much greater for the suppression of forest fires in 2019 compared to those in 1995 and 2008.
The table also provides a detailed weather environment comparison between the five forest fires. This shows that the Pigeon Valley fire involved only four hours over the first day when relative humidity was between 20 and 40 per cent, and no hours with wind speed greater than 30 kilometres an hour. This is a lot less time in the extreme danger zone when compared with the Mount Cook or Berwick fires. Wind speed was also greater than 30 kilometres an hour for Mount Cook fire for 19 hours and Berwick fire for 12 hours. Given these points of difference the Pigeon Valley fire environment following the first day was moderate when compared with the extreme conditions of the Port Hills, Onamalutu, Mount Cook and Berwick fires over the first two days.
When comparing the Mount Cook, Berwick and Port Hills fires with the Pigeon Valley fire, for the period during which there was elevated fire danger, the risk of spotting fires for Mount Cook Berwick and Port Hill were extreme, whereas for Pigeon Valley, following the first day, the probability for spot fires from the second to the seventh day was less than four per cent. In addition, for the Wakefield community on the south east areas of the fire, to be affected by this wild it had to breach the containment lines within the forest, burn downhill 1.5 kilometres through the remaining forested lands, travel 500 metres through pastoral grasslands, bridge a small river bed, and travel a further one kilometre before then presenting a threat to Wakefield.
If the incident management team had a strategy to pre-position adequate resources on the eastern flank of this fire to respond quickly, should a ground fire leave the forest lands and go on to pastoral lands this would have been adequate to cover the risk of less than a four per cent probability of spot fires. This is supported, as time has shown the fire did not spread from the forested lands on to pastoral lands on the south east flank of this fire. Given this probability, and the landscape, the construction of firebreaks external to the forested land, and the evacuation of people from their homes, on the south east flank of this wildfire, were not deemed necessary from a fire risk and management viewpoint.
| Number of hours with relative humidity less than 40 per cent over first two days | No of hours with wind greater than 30 km an hour over first two days | Number of hours in crossover | Area burned | Total cost | Cost per hectare | |
|---|---|---|---|---|---|---|
| Pigeon Valley Fire | 4 hours | 0 hours | 0 hours | 2,300 hectares | $17,000,000 | $7,400 |
| Port Hills Fire | 21 hours | 6 hours | 0 hours | 1,661 hectares | $7,900,000 | $5,800 |
| Onamalutu forest fire | 10 hours | 10 hours | 0 hours | 600 hectares | $1,294,000 | $2,157 |
| Mount Cook Station fire | 29 hours | 19 hours | 11 hours | 756 hectares | $749,000 | $991 |
| Berwick fire | 18 hours | 12 hours | Over 10 hours | 255 hectares | $250,000 | $980 |
Social effects
From overseas experience, evacuation from homes during a fire is inherently stressful because of the disruption to daily life and the uncertainty about what will happen. Indeed, evacuees have cited a lack of current information about fire activity and fire effects as one of the greatest challenges of evacuation. Although individuals vary in their responses, evacuation often elicits strong negative emotions which can have a lasting effects, such as post-traumatic stress, anxiety, health problems and lack of trust, on the individual and the community. Evacuation should be undertaken only when clear evidence confirms that homes will have a high risk of being affected by the fire.
Scion researchers have assessed the social effects of wildfires, but not necessarily evacuation. The NZ Forest Owners Association supported efforts to contact owners of small forests after the Pigeon Valley fire to help with forestry-related matters.
The 2019 Pigeon Valley fire affected the lives of those who owned lifestyle properties which were affected by this wildfire on the northern edge of the forested lands on the first day. The residents of Wakefield and other surrounding villages and hamlets who had to evacuate their properties were also affected. The forest owners who lost forest were also greatly affected, particularly the contractors who lost their livelihood during the days of the declared Civil Defence emergency.
Fortunately, in the week which followed the first day of this fire, the fire environment did not meet the same extreme levels present on the first day. This situation did not appear to have influenced the actions taken by the incident management teams when evacuation of families was also undertaken in communities along the south east area external to the forested lands. A further point of concern was the need to construct the extended length of firebreaks external to the forested lands and the damage which has resulted to this land.
Conclusions and recommendations
Lessons learned from extended wildfires in the past are critically important to review all aspects of the institutional, operational and financial implications of fire management. The comparison of the Pigeon Valley fire with similar fires in Berwick, Mount Cook Onamalutu Forest and the Port Hills fire can provide important lessons for any operational review or independent inquiry evaluating the performance of the Pigeon Valley wildfire.
- In comparison to the Port Hills, Onamalutu, Mount Cook and Berwick fires the Pigeon Valley fire did not have an elevated fire environment which produced the same extreme levels of high risk of spotting fires after the first day.
- The analysis of the fire weather data which was available to the incident management team at the time shows the risks resulting in ordering the evacuation and the major works to create firebreaks was low. It is unclear what additional or different information that the incident management team leaders were considering when they made their decisions.
- There seems to be a lack of clarity with the incident management team process when a wildfire incident becomes a Civil Defence emergency.
- There is a lack of forest fire behaviour specialists available to support decision-making for interpretation of risks in wildfire incidents in New Zealand and this urgently requires attention.
- There has been a distinct change in the strategy and operational management of wildfires with heavy deployment of aerial resources without adequate support from ground resources. This has had a major implications on effectiveness and the cost of fire management compared with the management and costs of past wildfires of a similar nature.
- It is recommended that an independent commission of inquiry be undertaken for the Pigeon Valley fire to review the strategic, technical and administrative performance and lessons learned, including from previous forest wildfires, along the lines of past independent inquiries such as for Mount White in 1973 and Canterbury in 1989.