GIS and indigenous forest management
Roger May, New Zealand Tree Grower February 2005.


A geographical information system (GIS) is a computerised mapping system which can be used for map production, operational planning, spatial analysis and record-keeping.
The advantages of GIS
The use of GIS in indigenous forest management is beginning to increase as forest managers start to recognise the advantages of the system. GIS can be used for mapping forest and vegetation types, streams, tracks and other important features, planning inventory or monitoring surveys, recording the locations and details of harvesting and other silvicultural operations, and to assist with forest management decision-making. GIS makes it easy to update maps as things change and it can also be used to display points and lines captured on a global positioning system.
 This article is about how GIS was used recently to plan a forest inventory survey as part of the preparation of a forest management plan. The key issue was to design a sampling regime to obtain estimates of standing timber volumes which were within the required limits of accuracy, and to do so at the least cost.
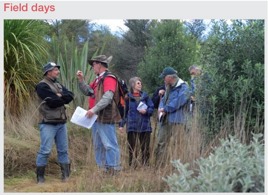
The most expensive stage
Collecting forest data is the most expensive stage in the process of preparing a forest management plan. Forest data collection generally involves one or more teams of people skilled in species identification and measuring, adept at finding predetermined locations in the bush and getting around difficult terrain. It is an expensive process because the task of locating sampling plots, measuring trees and recording the data is time-consuming. A key factor in the survey cost is the number of sample plots required. If too few plots are measured, the resulting estimates are not sufficiently precise. Conversely, if too many plots are measured, the accuracy of the estimates improves but the forest manager is faced with unacceptable survey costs.
The cost per plot for locating, marking, measuring, and recording plot data can range from $200 to $700 depending on the amount of data to be collected, the terrain to be traversed between plots, the degree of accessibility, and whether a helicopter is employed to move survey teams around. Good survey planning is therefore essential in order to obtain sufficient data to meet the specified degree of precision at the lowest possible cost to the forest manager. GIS is a useful tool in achieving this.
The GIS project
A geo-referenced digital photograph was obtained and loaded into the GIS. This allowed a preliminary visual assessment of the forest area and accurate locations and measurements of distances and areas to be taken off the GIS. The orthophoto was then used to delineate and digitise the boundaries of broad differences in forest type. The forest was separated into tall forest and cutover, and the tall forest separated into beech-tawa and tawa-podocarp.
Probable limit of error
Data from an earlier pilot inventory survey was then analysed to determine the amount of variation in the composition of each forest type. It was also used to determine the total number of sample plots required in order to achieve an estimate of forest volume with a probable limit of error of less than 20%. For example, the calculated probable limit of error of a standing forest volume of 300 cubic metres per hectare needs to be less than plus-or-minus 60 cubic metres per hectare.
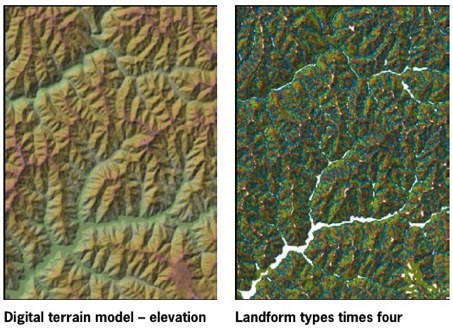
The digital terrain model
In broad terms, vegetation composition tends to reflect the landform, with other things such as soil variables being equal. So to ensure that sample plots were located in places which would better reflect the variation in vegetation composition and so provide reliable species volume estimates, landform was modelled and differentiated. This was done by building a digital terrain model in the GIS using 20-metre contour data. The digital terrain model was then used to differentiate four different landform types. These were – ridges and spurs (brown), faces (green), gullies and toes (blue), and flat areas (white).
The total number of sample plots required were then randomly located within each forest type and within each landform type in proportion to the area occupied by each forest type and each landform type. Map coordinates for each randomly located sample plot centre were then generated in the GIS. Their eastings and northings were used by the inventory crews to locate the plot centres in the field using GPS units and hipchains.
Once the data had been collected and analysed, the result was an estimate of standing forest volume with a probable limit of error just under plus-or-minus 20%. More importantly, the forest manager had achieved the required precision without paying for too many plots or having to revisit the forest to obtain more data.
The same approach can also be used for planning other types of indigenous forest surveys such as forest health or vegetation reconnaissance.
Roger May is a private forestry consultant based in Christchurch and specialising in ecological landscape mapping, forest and ecosystem management, data collection, urban tree management planning and forest management systems.