The science or art of forest inventory
Alan Bell, New Zealand Tree Grower August 2016.


Measuring trees should be easy enough. You plant so many per hectare and there are so many hectares. So what is all the fuss about? Well, trees have a habit of pleasing themselves a bit. Add in some natural variation and human forest management and after 25 years you end up with quite an unknown asset. That is why you need to measure them if you want to avoid big surprises at harvest time.
Why do you need forest inventory? Let us start with the statement – all trees are not equal. Even within one small woodlot there will be big trees and small trees despite being planted on the same day and having similar growing conditions. The key is that trees respond to microsite differences and to add more variation, forest management practices are not totally similar. For example, often cash flow dominates the tending regime, and thinning or pruning may be delayed or abandoned before completion.
Given the nature of forests it is not possible to check on the work easily. In some cases the forest may change hands and all previous history is lost. All of these reasons are why at some stage, if you want to know the value of the forest, then a forest inventory will be needed. Other reasons for forest inventory include –
- Asset value for accounting purposes
- Estate planning
- Buying and selling
- Ensuring you are getting value for money at harvest time
- Keeping the harvesting company honest
- Avoiding unexpected surprises.
Knowledge of your trees gives some control and allows you to compare options intelligently.
How to carry out an inventory
Measurement of net stocked area
Free on-line mapping systems are available if you have good internet coverage. GPS is also very useful for very small blocks. For larger blocks where there is serious mapping to be done, such as for exclusion of gaps and boundary problems, it is best to get a professional draughtsman on the job such as Manawatu Aerial Photo Services in Palmerston North.
Remember that the area is one of the most critical parameters for your woodlot value. Be aware that areas registered for the Emissions Trading Scheme are generally not as tight as normal net stocked area mapping. Emissions Trading Scheme areas may be higher by 10 per cent because they allow a larger edge buffer.
Sampling
Unless your forest is very small then it is inefficient to measure every tree so some kind of sampling is required. Small forests are unlikely to warrant the use of aerial measurement such as Lidar, and ground-based manual bounded plots are likely to give more usable information at reasonable cost. If differences in blocks are definable or there are multiple age classes then consider splitting and sampling each one independently, with the overall mean being weighted by area.
Sampling intensity
Sampling intensity is the ratio of area measured − the sampled area to total area. For example, if there are 10 plots of 0.06 hectares measured in a 20 hectare woodlot then the area sampled is 0.6 hectares and the sampling intensity is 0.6 divided by 20 which is three per cent.
Sampling intensity is usually between one and three per cent and is a compromise between cost and obtaining meaningful results. Sampling intensity should be related to the intended use of the results. For example, if a forest is being harvested on a managed sale basis then the intensity of sampling can be relaxed as there is not so much riding on the results. On the other hand if a lump sum sale is contemplated then a higher intensity and better coverage would be advisable.
Precision and accuracy
An accurate estimate is one that is close to the true mean, regardless of how it was derived. A precise estimate hopefully is accurate but that is not guaranteed, especially if the samples were biased. For example, if all the plots were located in sheltered gullies the mean might be precise as all the plots would be similar, but the mean would not represent the overall forest and would not be accurate. Therefore, precision represents the amount of variability about the mean whereas accuracy refers to how close the sample mean is to the true population mean. It is important to note this difference between accuracy and precision.
In reasonable sized blocks, say 15 hectares or more, it is reasonable to aim for a mean with a level of precision of around plus or minus 10 per cent. This is the standard in New Zealand plantation forestry sampling. However, in small woodlots the idea of aiming for a level of precision of 10 per cent is unrealistic.
Precision is normally referred to as the probable limit of error and is displayed as a percentage of the sample mean. In New Zealand forestry the probable limit of error is estimated at the 95 per cent probability level. For example, if we say that the mean total recoverable volume is 675 cubic metres a hectare and the probable limit of error is 8.9 per cent, then we are saying the mean is 675. But 95 times out of 100 we expect the true population mean to be within 8.9 per cent of 675 − within the range 615 to 735 cubic metres a hectare.
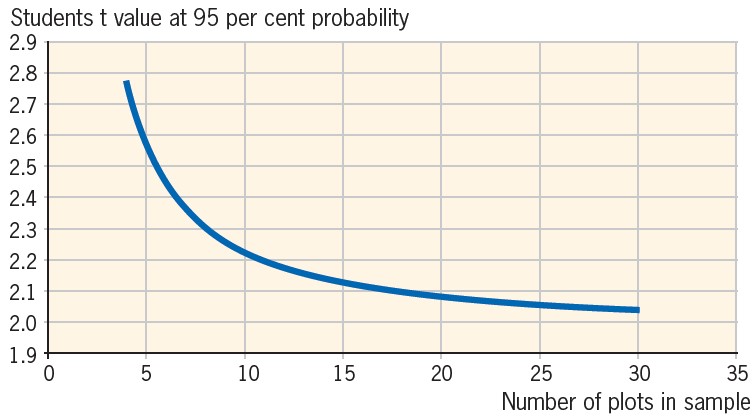
The level of precision depends on the natural variation within the sample plus the number of plots that are measured. The number of plots used affects the students ‘t’ value and this is multiplied by the standard error to arrive at the probable limit of error. As you can see in the graph, when number of plots is below 15, the ‘t’ value rises dramatically. This is why no matter what you do, the precision in small samples will always be low and often above the desired 10 per cent.
With small blocks it is not worth the effort of aiming for low precision. Just concentrate on covering the block and ensuring the sample represents the population.
Types of inventory
Quality control plots
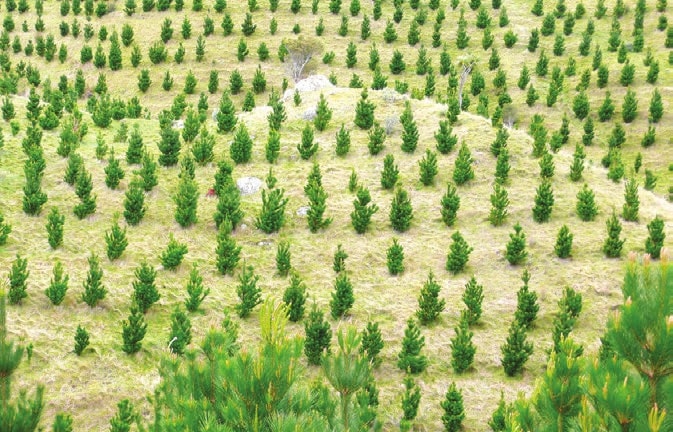
Quality control plots are normally used to check that a forest operation has been completed to a satisfactory standard. Examples are at planting when plots are used to check spacing and planting technique, at pruning to check pruned height, tree selection, diameter over stub and pruning quality, and at thinning when final stocking and tree selection are checked.
Quality control plots are often hard to deal with as they occur when the trees are young and there is a lot of undergrowth or thinnings on the ground. Because of this only the main parameters are measured.
It is common for quality control data to be developed in growth models to predict future harvest volumes by grade. This can be of some use but it should be remembered that growing trees from a young age is likely to result in an over-prediction of volume.
Mid-rotation inventory
Normally mid-rotation inventory takes place some years after all tending has been completed. The forest is basically finished in terms of treatment and just has to grow to maturity. Mid-rotation inventory is usually low intensity, covering between one and two per cent of the area, and is used for general wood flow planning, valuations and for due diligence.
The main drawbacks with mid-rotation inventory are that between the time of the inventory and maturity, branch sizes may increase and sweep may become less significant as diameter increases. Therefore, the later you carry out a mid-rotation inventory the better as you will record the grade aspects more effectively. A late mid-rotation inventory, for example when the trees are age 21 to 22 years, can be used with some confidence to predict log grade at harvest age and will give you some confidence in the earning capacity of your trees. You may not even need any further inventory in that stand.
Pre-harvest inventory
For both mid-rotation inventory and pre-harvest inventory you need to measure not just the basic parameters of stocking, diameter and height but also the stem description otherwise known as the cruising data. Each stem within each plot needs to be described in terms of its pruned height, branching, sweep and any malformation features. Most inventories today use the Plotsafe overlapping feature method and the data is analysed in a programme called YTGen. However, there are a few pockets of resistance still using Marvl − a method of recoverable volume by log type to collect the stem descriptions.
The good news is that this Marvl data can be brought into YTGen for analysis. YTGen is a superior product for analysing and growing inventory data but some field workers find the Marvl data collection method easier and simpler than using Plotsafe.
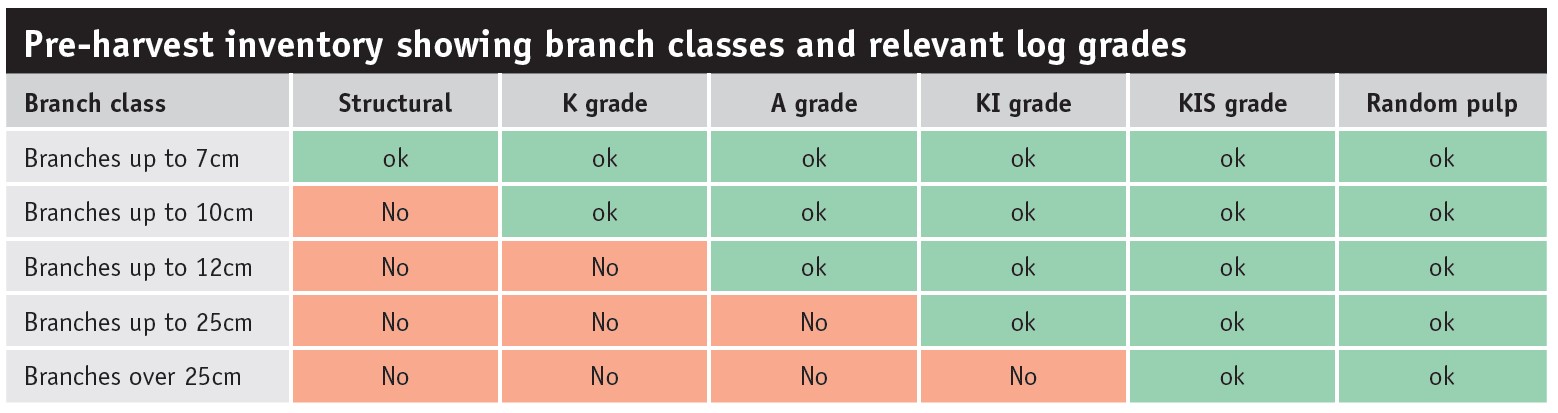
Pre-harvest inventory normally takes place within two or three years of intended harvesting and is mostly more intensive than mid-rotation inventory. Sampling intensity is usually around three per cent of the area. The aim of pre-harvest inventory is often to allow calculation of expected nett stumpage in the current markets. Therefore, it is important to ensure that the plots represent what is in the forest and that the stem descriptions can be used in the subsequent harvesting template. The table below gives a typical breakdown of where different sized branches end up in terms of log grades.
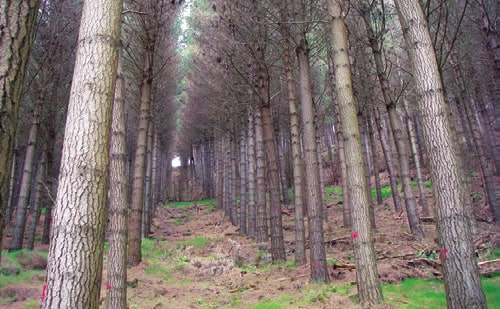
Circular bounded plots are most commonly used because these minimise the edge effect and are easier to locate and measure accurately. A plot size of 600 square metres adjusted for slope is suitable for most final crop stockings between 250 and 350 stems a hectare. Plots are normally located using GPS and all trees are numbered. Field measurement approach plots can be used as a guide to stocking, diameter, height and therefore total volume. However, unless they are fully measured for stem description, then the data will not be of benefit to predicting log grade outturn. One strategy would be check any plots that have already been installed in your forest.
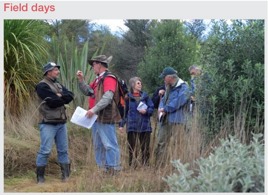
People
In the past there has been a tendency to use inexperienced workers or students to do forest inventory. The job was deemed to be low on the list of importance. Therefore, often the results from the inventory were likely to be compromised simply because the people doing it did not know much about trees and logs.
When it comes to your own trees it pays to take an interest as it is your asset which is at stake. Your level of interest might range from actually assisting in the tree measurement process or at least going through one or two plots with the crew. Alternatively, you could check or audit some of the plots after the crew has moved on although this strategy is of little use if you find that the crew were not doing a very good job.
Maintaining the integrity of the inventory
Normally when setting up an inventory the target is defined and the sampling intensity and inventory plan are determined using the defined parameters. It is important to realise that in the interests of efficiency most inventory plans are aimed at obtaining a reasonable level of precision. Occasionally part of a block will be harvested and the result will be compared with the inventory mean. It must be remembered that the mean relates to the whole area of trees being considered and may not necessarily represent only part of the block. The acid test is to compare the mean with the result from the whole block.
Similarly, an inventory may have been completed on a large block to a reasonable level of precision. During harvest planning someone decides to split out two or three plots that are within a certain logging setting and use these as a guide to results for that setting. This may be useful, but remember that the sample has suddenly reduced from perhaps 20 plots, to no more than three and the calculated confidence intervals will be large. Some of the common pitfalls include −
- Not enough plots
- Not enough trees of suitable height
- Under-estimation of branch sizes
- Not removing gaps from stocked area
- Not recognising sweep when checking stems
- Using Emissions Trading Scheme areas for normal forest operations
- Unrepresentative samples that do not cover the range of variation
- Neglecting to check or interpret yield projections to see if they are realistic.
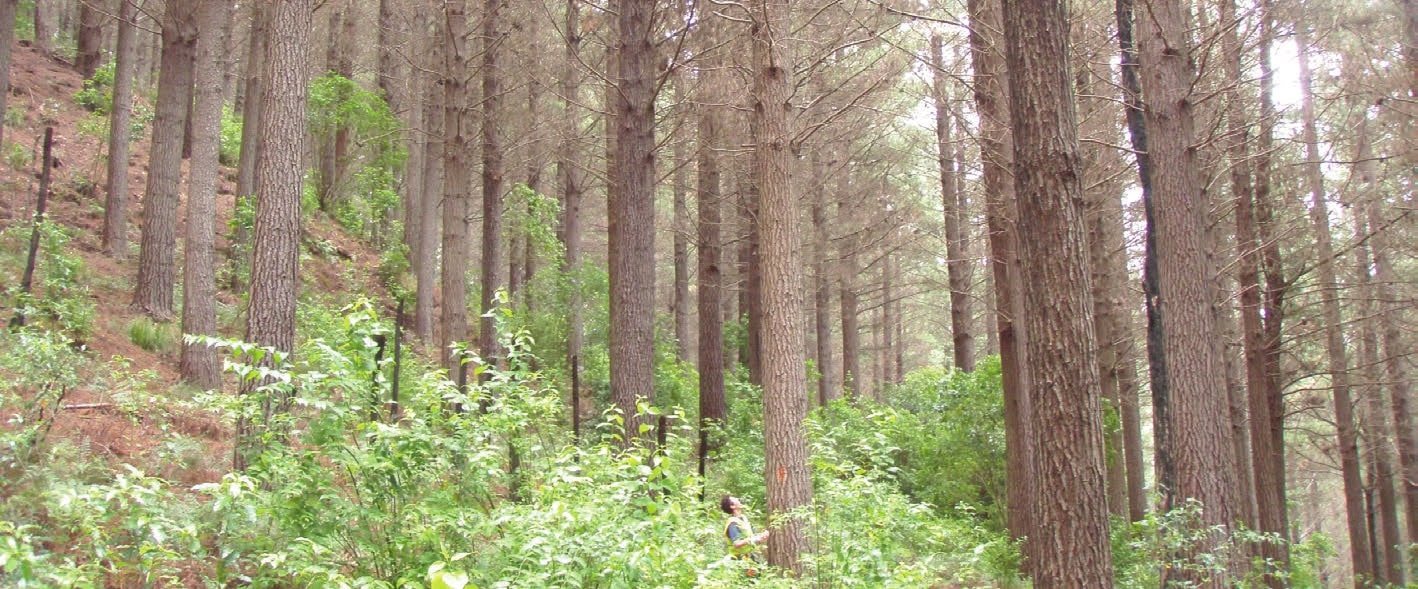
Not all trees are equal
No amount of tree breeding can overcome the effect of wind and shallow soils on ridgelines. Trees will always be better on sheltered sites. At age 25 or thereabouts, your trees are the result of not only your good or bad management but they will show the effects of site and climate. For example, even the best farm forester will struggle to grow a good tree on top of a windy ridge. Conversely, almost anyone can grow a reasonable tree on a sheltered fertile site. Sometimes trees look good at a glance but do not measure up when you actually spend time describing them in detail.
Qualities needs to match log grades
A forest inventory needs to relate to real log grades to some extent. For example, we know that main branch size classes are normally up to 7 cm for structural grade and up to 10 cm for K grade sawlogs with log small end diameter of 20 cm for export sawlogs.
For A grade sawlogs branch sizes are up to 12 cm with the log small end diameter 30 or 40 cm. For industrial export sawlogs branch diameter can be up to 25 cm. So when you hire an inventory crew you need to make sure they are going to describe branches in these categories.
Analysing the data
When analysing the inventory make sure the log cutting schedule is reasonably close to reality, especially the small end diameters and log lengths that are currently in demand. They change over time and with different log buyers.
When looking at potential returns make sure you account for Japanese Agricultural Standard or Jas conversion. Prices at the wharf gate are normally in dollars per Jas and there is usually a loss when converting from tonnes to Jas. This is due mainly to taper. Logs from older stands and from the bottom of trees usually have better Jas conversion, whereas young trees and smaller logs from the upper stem will have low conversion.
Despite what some people will tell you there will always be a certain amount of random pulp logs in your forest. This is because even export pulp logs are actually destined to be sawn and it needs to be within reasonable limits of sweep. So be prepared to sell some true pulp logs or to leave it on site. However, the latter is not good for the next rotation and increases the mess around skid sites.
Alan Bell & Associates, based in Lower Hutt.