Carbon accounting for less commonly grown tree species
Dean Meason, Yue Lin, Serajis Salekin, Barbara Höck and Leslie Dowling, New Zealand Tree Grower November 2020.
Carbon units are allocated to eligible forests which have an area less than 100 hectares by using a look-up table. This is based on average carbon sequestration rates under the Emissions Trading Scheme. It works well for radiata pine and Douglas-fir. However, all other commonly grown non-native species are grouped into two generalised tables for either exotic softwoods or exotic hardwoods.
Indigenous forest species are grouped into the single forest type indigenous forest – which applies whether the vegetation is regenerating or planted and managed. These catch-all tables are based on national averages and more accurate tables are needed to estimate tree growth and carbon stock on different sites.
Good quality data on growth rates and models for different forestry species under varying New Zealand conditions is required to develop more accurate species specific tables. Unfortunately, the data available is patchy for most of the less commonly grown species, those other than radiata pine and Douglas-fir. Planting over the last several decades has been sporadic, the ages of stands are not well distributed over the lifetime of a species and stands are usually concentrated in one or two regions.
Which species
The eucalypt Eucalyptus nitens, coast redwood Sequoia sempervirens, selected cypresses Cupressus lusitanica and C. macrocarpa, totara Podocarpus totara and planted manuka Leptospermum scoparium were selected as the tree species be most likely to be planted for carbon forests. The selection was made by invitees at a workshop held in Wellington arranged by Scion in November 2017.
The attendees were either interested in the project’s results or had experience in carbon forests. They included representatives from the NZFFA, Pamu, Tane’s Tree Trust, Forest Growers Levy Trust, Juken New Zealand, New Zealand Redwood Company, NZ Forestry, Horizons Regional Council, Scion and the Ministry for Primary Industries.
The criteria for inclusion of the tree species included cultural and social values, ease of establishment, ability to grow on a range of sites, species longevity, potential ecosystem services, ability to propagate, low wilding risk and minimal management and silviculture requirements. A further consideration was competitive advantage and profitability – as back-up in case of problems with the Emissions Trading Scheme.
Random forests
Researchers from Scion and Manaaki Whenua Landcare Research combined data to develop growth models for each species. Even with the combined data, there were still significant gaps with some regions being poorly represented for some or all the species. These gaps meant that the traditional growth models used to predict productivity and therefore carbon stock could not be used.
The researchers took an alternative option, choosing to use a machine learning technique called random forests. With machine learning, computer programmes are given some starting examples then look into the data for patterns and learn as they go, all without human interference or bias.
Random forests, named because it builds a multitude of decision options, was trained to model the diameter at breast height for each of the species using five site factors, 24 climate-related variables, stand age and stocking rate. The modelled results were checked against field values from a sample of trees. Overall, the models were able to explain more than 90 per cent of the variation in the tree diameter at breast height for all five species.
Diameter at breast height was used as a measure of site productivity, instead of the more usual tree height, because a large number of plots had no height data. Diameter at breast height is affected by stocking rate, so this was an important variable in the modelling process. Individual tree diameter at breast height was used to predict tree height, then tree volume and finally the amount of carbon sequestered by the selected species.
Selected cypress
The cypress species in the combined database were predominantly lusitanica and macrocarpa, with lusitanica dominant in the North Island and macrocarpa dominant in the South Island. The random forest model
explained 80 per cent of individual tree variation, and the differences between the two species were found to be insignificant. In addition, there were only small differences between the estimated above ground biomass
and wood density equations between the two species.
As a result, a combined model was used to predict carbon stock for both species. The model predicted that at age 30 and at a stocking rate of 450 stems a hectare, the West Coast region would have the highest average carbon stock potential of 112 tonnes of carbon per hectare. The carbon stock in the Canterbury region would be the lowest at 57 tonnes of carbon per hectare. The overall average for this regime was 84 tonnes of carbon per hectare.
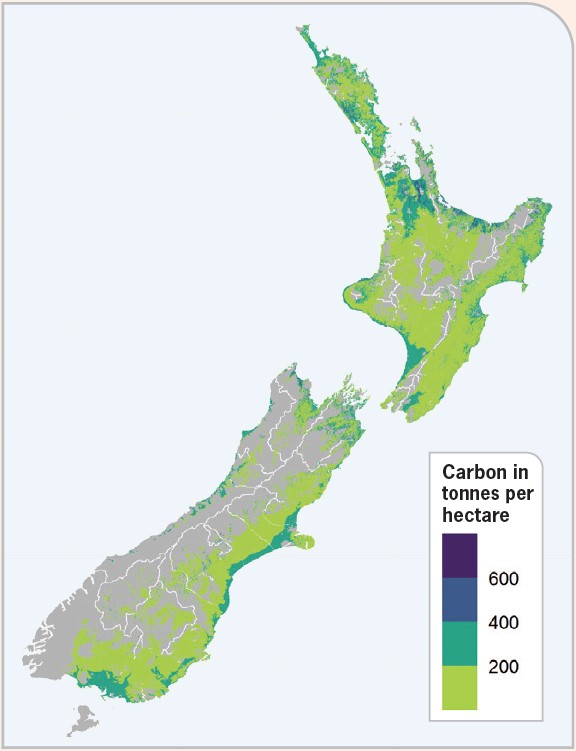
Eucalypts
The tree plot data for Eucalyptus nitens has a reasonably good national distribution covering the country, with the exception of the lower North Island and Taranaki. The model was able to explain 88 per cent of individual tree diameter at breast height variation. Based on the model’s predictions, trees at age 15 and a stocking of 470 stems a hectare, the highest average carbon stock potential is in the Northland region, with 223 tonnes of carbon per hectare. Otago has the lowest at 54 tonnes of carbon per hectare.
The overall average for this regime was 134 tonnes of carbon per hectare. The model assumes that the stands are healthy and not affected by eucalypt tortoise beetle Paropsis charybdis, which is present in most parts of New Zealand.
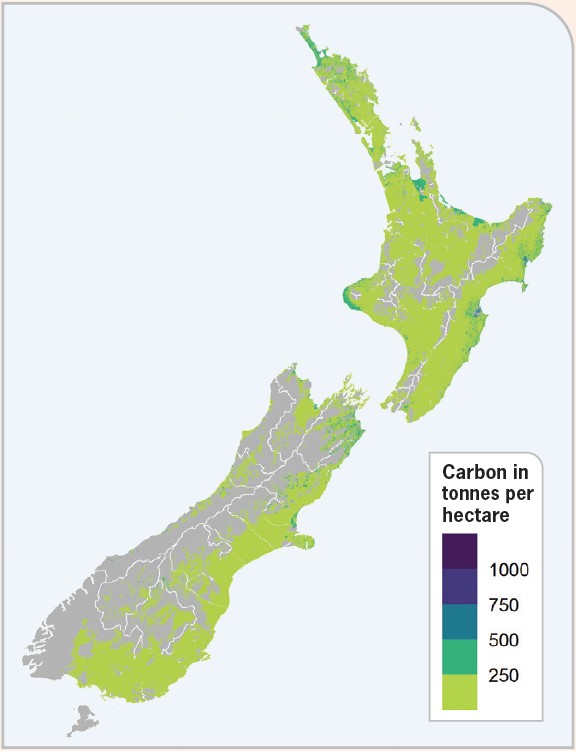
Coast redwood
Coast redwood had good coverage in the North Island in general, with the exception of Northland. Data in the South Island is limited compared to the North Island. The model was able to explain just under 80 per cent of individual tree diameter at breast height variation. Based on the predictions, at age 40 and at a stocking rate of 400 stems per hectare, the Bay of Plenty and Taranaki regions have the highest average carbon stock potential of 305 tonnes of carbon per hectare.
The Wellington region had the lowest at 182 tonnes of carbon per hectare. The overall average was 245 tonnes of carbon per hectare.
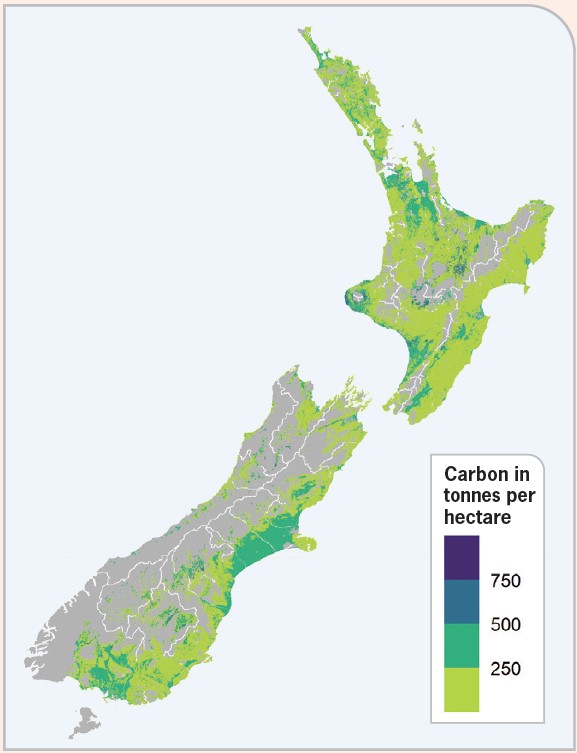
Totara
Most of the totara data was clustered in Northland. Nevertheless, the best model for totara was able to explain 80 per cent of the diameter at breast height variation. Based on the predictions, totara generally grew better in the North Island. At age 40 and at a stocking rate of 1,140 stems a hectare, totara in the Auckland region had the highest average carbon stock potential of 263 tonnes of carbon per hectare while inland Canterbury had the lowest of 113 tonnes of carbon per hectare. The overall average for this regime was 186 tonnes of carbon per hectare. The highest productivity category for this species was at low elevation areas
and close to the sea. It is possible that the model overpredicts carbon stock potential south of Auckland.
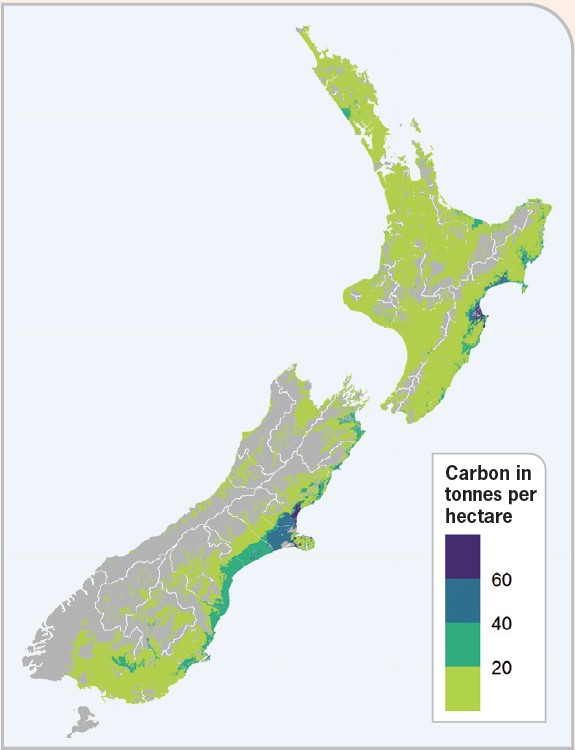
Planted manuka
Planted manuka had a relatively good spread of plots over the North Island, but the number of plots in the South Island was more limited. The best model for planted manuka explained 70 per cent of the variation.
Based on the predictions, at age 20 and at a stocking rate of 1,600 stems a hectare, the Canterbury region had the highest average carbon stock potential of 20 tonnes of carbon per hectare.
The Whanganui and Manawatu region had the lowest of nine tonnes of carbon per hectare. The overall regional average for this regime was 13 tonnes of carbon per hectare.
Over prediction
The models tend to over-predict growth for some species due to the relative importance of the elevation variable, in other words the height above sea level. Caution is needed in interpreting some of the results. This may be the case for E. nitens at low elevation and close to the sea for both islands.
With coast redwood, the model predicted highest productivity category in some unusual inland areas of both islands. In the case of totara, there is the potential for carbon stock over-prediction south of Auckland.
The carbon stock potential for planted manuka at low elevation and close to the sea for both islands may also be over-predicted. This can be mitigated by averaging the carbon stock potential of the species at the district or regional level.
General conclusions
The models which have been created are stable and able to explain the variation of 70 to 88 per cent seen in diameter at breast height for the selected species. This is a substantial improvement on existing models. Using machine learning has provided unbiased predictions directly based on species actual sensitivities to various site and environmental factors. It has removed the bias and knowledge gaps which can occur when expert based site species selections are used.
Random forests modelling was affected by limited data being available for some species and the limited distribution of existing plots. The quality of the results would be improved by collecting more site data from existing plots. The Ministry for Primary Industries will summarise the project results for each species for the Emissions Trading Scheme.
Owners of small to medium forests can use the results of this work to compare the predicted performance of several species at any given site. This direct comparison of apples with apples allows land owners to weigh up options for planting species other than radiata pine and Douglas-fir for carbon sequestration and other economic, environmental and social aims. At a larger scale, councils and other organisations can use the information to help make decisions around afforestation programmes.